UNITED STATES

SCHEDULE 14A INFORMATION
Proxy Statement Pursuant to Section 14(a)
of the Securities Exchange Act of 1934
(Amendment No. )_________________________
Filed by the Registrant x
Filed by a Party other than the Registrant o
Check the appropriate box:
Check the appropriate box:
o Preliminary Proxy Statement
o Confidential, For Use of the Commission Only (as Permitted by Rule 14a-6(e)(2))
x Definitive Proxy Statement
o Definitive Additional Materials
o Soliciting Material Pursuant to §240.14a-11(c) or §240.14a-12
KAMAN CORPORATION(Name of Registrant as Specified in Its Charter)
(Name of Person(s) Filing Proxy Statement, if other than the Registrant)
| Filed by the Registrant | x |
| Filed by a Party other than the Registrant | o |
Check the appropriate box:
| Check the appropriate box: |
| o | Preliminary Proxy Statement |
| o | Confidential, For Use of the Commission Only (as Permitted by Rule 14a-6(e)(2)) |
| x | Definitive Proxy Statement |
| o | Definitive Additional Materials |
| o | Soliciting Material Pursuant to §240.14a-11(c) or §240.14a-12 |
Payment of Filing Fee (Check the appropriate box):
| Payment of Filing Fee (Check the appropriate box): |
| x | No fee required. | |
| o | Fee computed on table below per Exchange Act Rules 14a-6(i)(1) and 0-11. | ||
| (1 | Title of each class of securities to which transaction applies: |
| (2 | Aggregate number of securities to which transaction applies: |
| (3 | Per unit price or other underlying value of transaction computed pursuant to Exchange Act Rule 0-11 (set forth the amount on which the filing fee is calculated and state how it was determined): |
| (4 | Proposed maximum aggregate value of transaction: |
| (5 | Total fee paid: |
| o | Fee paid previously with preliminary materials. |
| o | Check box if any part of the fee is offset as provided by Exchange Act Rule 0-11(a)(2) and identify the filing for which the offsetting fee was paid previously. Identify the previous filing by registration statement number, or the form or schedule and the date of its filing. |
| (1) | Amount Previously Paid: |
| (2) | Form, Schedule or Registration Statement No.: |
| (3) | Filing Party: |
| (4) | Date Filed: |

27, 2012
We also want to let you know that Charles H. Kaman, our founder, passed away recently at the age of 91. Charlie was a visionary aerospace executive, an accomplished inventor, a highly talented musician, and a leader and mentor to many long-serving Kaman employees. His contribution to our company, our industry and our country cannot be overstated. His legacy will endure and he will continue to serve as an inspiration to all Kaman employees.
![[GRAPHIC MISSING]](https://capedge.com/proxy/DEF 14A/0001144204-11-011585/sig_nkeating.jpg)

4. To ratify the appointment of KPMG LLP as the company’s independent registered public accounting firm.
5.
BY ORDER OF THE BOARD OF DIRECTORS
![[GRAPHIC MISSING]](https://capedge.com/proxy/DEF 14A/0001144204-11-011585/sig_clark-candace.jpg)
Candace A. Clark
Dated February 28, 2011
| Date: | February 27, 2012 | BY ORDER OF THE BOARD OF DIRECTORS | |
 | |||
| Candace A. Clark | |||
| Senior Vice President, Chief Legal Officer, and Secretary | |||
Table of Contents
PROXY STATEMENT FOR ANNUAL MEETING OF SHAREHOLDERS
18, 2012
.3 shares of Common Stock held by those present at the annual meeting or for which proxies are properly provided by telephone, Internet or in writing and returned to the company as provided herein will be considered to be represented at the annual meeting. All shares of Common Stock represented at the annual meeting will be counted for quorum purposes without regard to abstentions or broker non-votes as to any particular item. In determining whether or not to accept a Director’s resignation for failure to secure a majority of the votes cast for him or her, the Corporate Governance Committee and the Board will consider the matter in light of the best interests of the company and its shareholders and may consider any information that they recent revised broker voting regulations, the only routine matter for the company’s 20112012 annual meeting and the only matter for which brokers will have the discretion to vote, is Proposal 43 (Ratification of Auditors)Independent Public Accounting Firm). The broker must have proper instructions from you in orderProposalsProposal 1 (Election of Directors), and Proposal 2 (Advisory Vote on Executive Compensation) and Proposal 3 (Advisory Vote on Frequency of Executive Compensation Advisory Votes). Without proper instructions from you, the broker will not have the power to vote on those threetwo proposals and this will be considered a “broker non-vote” for each such proposal. We recommend that you contact your broker to assure that your shares are properly voted.3 and 43 and 4,3, a majority of the votes entitled to be cast on each matter by Common Stock holders will constitute a quorum for action on that matter. For this purpose, onlyrequires that there be more votes cast for the Proposal than against the Proposal. Approval of the Advisory Vote on Frequency of the Advisory Executive Compensation Vote (Proposal 3) also requires that there be more votes cast for the Proposal than against the Proposal. If none of the frequency choices receives sufficient votes for approval under the state law voting requirement, the frequency choice that receives the most votes will be considered by the Board to be the expression of the company’s shareholders as to their preference and will be taken into account by the Board in making its determination as to the frequency of future advisory votes on executive compensation. Approval of the ratification of KPMG LLP as the company’s independent registered public accounting firm (Proposal 4) requires3) require that there be more votes cast for theeach Proposal than against theeach Proposal.4; Consideration of Proposal 3 Results4 and as to Proposal 3, the board recommends a vote for “One Year”.3. The Board does not know of any matters to be presented for consideration at the meeting other than the matters described in those Proposals and the notice of annual meeting of shareholders. However, if other matters are presented, the persons named in the proxy intend to vote on such matters in accordance with their judgment.“Corporate Governance”)the “Governance” link) that addresses certain circumstances when a Director nominee has not received a majority of the votes cast with respect to that director’s elections or re-election. Briefly, in an uncontested election for Directors (one in which the number of nominees does not exceed the number of Directors to be elected) at a properly called and held meeting of shareholders, any Director nominee who is elected by a plurality vote, but does not receive a majority of the votes cast for that nominee shall promptly tender his or her resignation once the shareholder vote has been certified by the company’s tabulation agent. A “majority of the votes cast” means that the number of shares voted “FOR” a Director’s election exceeds fifty percent (50%) of the number of votes cast with respect to that Director’s election. “Votes cast” include votes to withhold authority and exclude abstentions and broker non-votes with respect to that Director’s election. The Corporate Governance Committee will thereafter recommend to the Board whether to accept or reject that resignation and, depending on the recommendation, whether or not a resulting vacancy should be filled. The Board will then act, taking into account the Committee’s recommendation. The Board will publicly disclose its decision and the rationale therefor in a press release to be disseminated in the customary manner, together with the filing of a Current Report on Form 8-K with the SEC. This process shall be completed within ninety (90) days after the shareholder vote certification. A Director who has tendered his or her resignation shall not participate in the Corporate Governance Committee’s determination process and/or the Board’s action regarding the matter.considerbelieve is relevant and appropriate, including the:Nasdaqapplicable stock exchange rules or federal securities laws) or triggering defaults or other adverse consequences under material contracts or the acceleration of change in control provisions and other rights in employment agreements, if applicable.
A. William Higgins.
![[GRAPHIC MISSING]](https://capedge.com/proxy/DEF 14A/0001144204-11-011585/b211797_pix-barents.jpg)  | Mr. Callaway, 64, has been a director since 1995. He is the Founder and President and Chief Executive Officer of The Callaway Companies, an engineering services firm which is involved in the high technology composites industry and has presence in Europe and the U.S. With this background, Mr. Callaway provides the Board with senior executive insight into the conduct of global operations, the composites business, and marketing and sales trends. |
| Karen M. Garrison | |
 | Ms. Garrison, 63, has been a director since 2006. She retired as President of Pitney Bowes Business Services, a major manufacturer of postal equipment/software and service provider, in 2004. She is a director of Standard Parking Corporation and Tenet Healthcare and during the past five years was a director at North Fork Bank. These positions demonstrate Ms. Garrison’s senior executive roles which provide operational insight to the Board, particularly from acquisition, human resources, information technology, government contracting and distribution perspectives. Ms. Garrison also brings to the Board extensive experience in finance and accounting, from her Bachelor of Science degree in Accounting from Rollins College and Master of Business Administration from Florida Institute of Technology to progressively senior roles as Controller, Worldwide Controller, Vice President — Finance and Chief Financial Officer over a ten-year period during her tenure at Pitney Bowes and its subsidiary, Dictaphone Corporation. This experience was important to the Board in connection with her initial election as a means to provide additional depth of capability to the Finance and/or Audit Committees. In fact, during her previous tenure on the Board’s Audit Committee, Ms. Garrison was designated an “audit committee financial expert” as defined by SEC regulations. |
| A. William Higgins | |
 | Mr. Higgins, 53, has been a director since 2009. He is Chairman, CEO and President of CIRCOR International, Inc., a global diversified manufacturing company that designs, manufactures, and supplies valves, related products and services to OEMs, processors, manufacturers, the military, and utilities that rely on fluid-control to accomplish their missions. Prior to March 2008, he held the offices of President and Chief Operating Officer and Executive Vice President and Chief Operating Officer of CIRCOR. Prior to joining CIRCOR in 2005, Mr. Higgins spent thirteen years in a variety of senior management positions with Honeywell International and Allied Signal. Leslie Controls, Inc., a wholly owned subsidiary of CIRCOR and an entity for which Mr. Higgins serves as a director and vice president, filed for bankruptcy in July 2010 attributable to asbestos litigation involving Leslie Controls. Mr. Higgins’ professional background provides the board with additional perspective on talent development, international operations and global strategic development, lean manufacturing and continuous improvement processes, the defense industry, acquisitions, and both distribution and aerospace markets. In addition to his service at CIRCOR, Mr. Higgins’ experience at Honeywell International and Allied Signal provided him with a strong background in the aerospace industry. The fact that Mr. Higgins is a sitting CEO also provides the Board with important insights regarding the perspective of an executive leading another global company of roughly similar size. |
| Neal J. Keating | |
 | Mr. Keating, 56, was elected President and Chief Operating Officer as well as a Director of the company in September 2007. In January 2008, he became President and Chief Executive Officer and in March 2008 he was appointed to the additional position of Chairman. Prior to joining the company, Mr. Keating served as Chief Operating Officer at Hughes Supply, a $5.4 billion wholesale distributor that was acquired by Home Depot in 2006. Prior to that, he held senior positions at GKN Aerospace, an aerospace subsidiary of GKN, plc, and Rockwell Collins, Commercial Systems, and was a board member for GKN, plc Augusta-Westland. He is a director of Hubbell Incorporated. These positions demonstrate Mr. Keating’s extensive history of senior executive leadership and board participation in both of the company’s business segments (Aerospace and Industrial Distribution) with emphasis on international operations and acquisitions experience. The Board believes that Mr. Keating’s combined role of CEO and Chairman provides the company’s shareholders with the benefits of board leadership by an executive with extensive professional background as well as day-to-day knowledge of the company’s businesses and markets, strategic plan execution, and future needs. |
| Eileen S. Kraus | |
 | Ms. Kraus, 73, has been a Director since 1995 and currently serves as the board’s Lead Independent Director. She is the retired Chairman of Fleet Bank Connecticut and is a director of Stanley Black & Decker, Inc. and Rogers Corporation. Ms. Kraus provides the Board with broad financial and operational management experience in the banking industry, having served in several positions at Fleet Bank, N.A. and its predecessors over approximately a twenty-year period. Her industry experience provides the Board with additional perspective on the banking and financial industries, marketing and acquisitions. She also has significant board organizational leadership experience with manufacturing companies, including membership on the Corporate Governance Committee of the boards of Stanley Black & Decker and Rogers Corporation; at Rogers Corporation she is Chairman of that committee. She is also chairman of the Stanley Black & Decker board audit committee. |
| Richard J. Swift | |
 | Mr. Swift, 67, has been a Director since 2002. He is former Chairman of the Financial Accounting Standards Advisory Council and retired Chairman, President and Chief Executive Officer of Foster Wheeler Ltd., a provider of design, engineering, construction, and other services. He is a director of Ingersoll-Rand Company, Ltd., Public Service Enterprise Group Incorporated, Hubbell Incorporated and CVS Caremark Corporation. Mr. Swift brings to the Board broad operations management experience in a career with Foster Wheeler, Ltd. that spanned almost thirty years and involved increasingly senior executive leadership positions culminating in his role as Chairman and CEO for seven years. Mr. Swift also has finance experience with a Masters of Business Administration from Fairleigh Dickinson University and service in the role of Chairman of the Financial Accounting Standards Advisory Council for about five years. He is also a Licensed Professional Engineer. In addition, he has audit committee and/or compensation committee membership experience on the boards of Ingersoll-Rand Company, Ltd. Public Service Enterprise Group Incorporated, Hubbell Incorporated, and CVS Caremark Corporation. This type of experience is important to the Board as a means to provide additional depth of capability to the Audit and Personnel & Compensation Committees. Mr. Swift’s background also provides the Board with additional perspective on international operations, financial management, investments, acquisitions, and other finance-related matters. |
| Brian E. Barents | |
 | Mr. Barents, |
![[GRAPHIC MISSING]](https://capedge.com/proxy/DEF 14A/0001144204-11-011585/b211797_pix-minnich.jpg) | |||
| George E. Minnich | |||
 | Mr. Minnich, | ||
As described above, Mr. Minnich provides the Board with extensive financial and accounting experience gained over a more than thirty-five year | |||
![[GRAPHIC MISSING]](https://capedge.com/proxy/DEF 14A/0001144204-11-011585/b211797_pix-rabaut.jpg) | |
| Thomas W. Rabaut | |
 | Mr. Rabaut, |
![[GRAPHIC MISSING]](https://capedge.com/proxy/DEF 14A/0001144204-11-011585/b211797_pix-callaway.jpg) | ||
![[GRAPHIC MISSING]](https://capedge.com/proxy/DEF 14A/0001144204-11-011585/b211797_pix-garrison.jpg) | ||
![[GRAPHIC MISSING]](https://capedge.com/proxy/DEF 14A/0001144204-11-011585/b211797_pix-higgins.jpg) | ||
Class 2 Directors Whose Term Expires in 2013
![[GRAPHIC MISSING]](https://capedge.com/proxy/DEF 14A/0001144204-11-011585/b211797_pix-keating.jpg) | ||
![[GRAPHIC MISSING]](https://capedge.com/proxy/DEF 14A/0001144204-11-011585/b211797_pix-kraus.jpg) | ||
![[GRAPHIC MISSING]](https://capedge.com/proxy/DEF 14A/0001144204-11-011585/b211797_pix-swift.jpg) | ||
Director Whose Term Will End at the 2011 Annual Meeting
Mr. Edwin A. Huston, a director since 2002, will retire coincident with the 2011 annual meeting as he has reached mandatory retirement age under the company’s Bylaws. With Mr. Huston’s retirement, the Board will decrease its size to nine members. Mr. Huston has served the board with distinction, including in his role as chairman of the board’s Audit Committee since 2006. The company and other board members are grateful for Mr. Huston’s guidance and support over the years.
The following table describes the current members of each committee and the number of meetings held during 2010:
| Board Member | Audit Committee | Corporate Governance Committee | Finance Committee | Personnel & Compensation Committee | ||||
| Brian E. Barents | X | X | ||||||
| E. Reeves Callaway III | X | X | ||||||
| Karen M. Garrison | X | Chair | ||||||
| A. William Higgins | X | |||||||
| Edwin A. Huston | Chair | X | ||||||
| Neal J. Keating(1) | ||||||||
| Eileen S. Kraus(2) | X | Chair | ||||||
| George E. Minnich | X | X | ||||||
| Thomas W. Rabaut | X | X | ||||||
| Richard J. Swift | X | Chair | ||||||
| Number of Meetings | 8 | 5 | 7 | 6 |
| Board Member | Audit Committee | Corporate Governance Committee | Finance Committee | Personnel & Compensation Committee | ||||
| Brian E. Barents | X | X | ||||||
| E. Reeves Callaway III | X | X | ||||||
| Karen M. Garrison | X | Chair | ||||||
| A. William Higgins | X | X | ||||||
Neal J. Keating(1) | ||||||||
Eileen S. Kraus(2) | X | Chair | ||||||
| George E. Minnich | Chair | X | ||||||
| Thomas W. Rabaut | X | X | ||||||
| Richard J. Swift | X | Chair | ||||||
| Number of Meetings | 7 | 4 | 4 | 5 | ||||
| (1) | Not an independent Director |
| (2) | Lead Independent Director |
matters. The committee meets regularly in executive session with the chief internal audit director and the independent auditor without management present.
While the board has determined that Edwin A. Huston,
S-K.
responsibilities also include review of the company’s annual business plan and long range planning strategies; all forms of major debt issuances; the financial aspects of proposed acquisitions or divestitures that exceed transaction levels for which the Board has delegated authority to management; material capital expenditures; methods of financing; and the company’s relationship with its lenders.
2011.
Committee reviews the company’s short and long-term business plans, certain proposed acquisitions or divestitures (including consideration of any substantial diversification from current business operations), any significant debt/equity issuances, and risk management programs from an insurance coverage perspective. The company’s Assistant Vice President — Corporate Risk, Safety and Environmental Management also reports directly to the committee on a periodic basis. The Personnel & Compensation Committee reviews and approves the company’s executive compensation strategies and programs related to annual, longer term and equity incentives and the business unit and corporate performance goals associated therewith, monitors management progress in compliance with stock ownership guidelines, considers and approves all employment-related agreements or termination arrangements with the company’s Exchange Act Section 16 “executive officers” and periodically reviews policies related to management development. The Corporate Governance Committee reviews the company’s succession plan for the CEO and other top senior management, assures annual evaluation of Board performance, establishes selection criteria for new directors, and manages the annual CEO evaluation process. The charters of each Committee are more fully described above beginning at page 11.
8.
candidates from so-called “minority” categories, including women and individuals of varied national origin. Consideration of diversity has been an element communicated to the third-party search firms in each of the director searches in the past several years.
2011.
2011.
NON-EMPLOYEE DIRECTOR COMPENSATION
The Corporate Governance Committee reviews our non-employee director compensation policies on a biennial basis with the assistance of the independent consultant to the Personnel & Compensation Committee. In light of economic conditions at the time, the 2009 regularThe most recent review was postponed with the approval of the Corporate Governance Committee and the Board. The review was then conducted in 2010 with assistance from the independent consultant, who analyzed reports of the Conference Board, the National Association of Corporate Directors and Towers Watson as well as the director pay practices of the Russell 2000 peer companies against which the company benchmarks its executive compensation program (Exhibit 1 to this proxy statement).program. This analysis resulted principally in a recommendation to the Corporate Governance Committee to provide a larger portion of director fees in the form of equity by determining the equity portion of director fees equivalent to a fixed dollar amount and to increase the cash retainer for committee chairs except for the Audit Committee. The Boardfollowing table summarizes the fee schedule approved by the recommended fee schedule,Board effective July 1, 2010. The following table compares the previous and revised fee schedules:
| Kaman Corporation Board of Directors Retainer and Meeting Fees | ||||||||
| Effective 1/09 – 6/30/10 | Effective 7/1/10 | |||||||
| Cash | ||||||||
| Retainer Fees (payable quarterly in arrears): | ||||||||
| Board | $ | 45,000 | $ | 45,000 | ||||
| Lead Director | 30,000 | 30,000 | ||||||
| Committee Chairmen: | ||||||||
| Audit Committee | 15,000 | 15,000 | ||||||
| Corporate Governance Committee | 6,000 | 7,500 | ||||||
| Personnel & Compensation Committee | 7,500 | 10,000 | ||||||
| Finance Committee | 6,000 | 6,500 | ||||||
| Board per Meeting Fee | 1,500 | 1,500 | ||||||
| Committee per Meeting Fee | 1,500 | 1,500 | ||||||
| Committee Chairman per Meeting Fee | 1,800 | 1,800 | ||||||
| Vice Chairman (non-employee, per meeting when serving as Chair) | N/A | N/A | ||||||
| Restricted Stock Award** | 2,000 shares | Shares having fair market value equal to $80,000 | ||||||
| Estimated Annual Fees | ||||||||
| Total estimated annual compensation for a Director sitting on two committees (non chair, 5 meetings per Committee) and stock price of $28 per share | $ | 125,000 | $ | 149,000 | ||||
| Kaman Corporation Board of Directors Retainer and Meeting Fees | |||||
Effective 7/1/10 | |||||
| Cash | |||||
| Retainer Fees (payable quarterly in arrears): | |||||
| Board | $ | 45,000 | |||
| Lead Director | 30,000 | ||||
| Committee Chairmen: | |||||
| Audit Committee | 15,000 | ||||
| Corporate Governance Committee | 7,500 | ||||
| Personnel & Compensation Committee | 10,000 | ||||
| Finance Committee | 6,500 | ||||
| Board per Meeting Fee | 1,500 | ||||
| Committee per Meeting Fee | 1,500 | ||||
| Committee Chairman per Meeting Fee | 1,800 | ||||
| Vice Chairman (non-employee, per meeting when serving as Chair) | N/A | ||||
| Restricted Stock Award** | Shares having fair market value equal to $80,000 | ||||
| Estimated Annual Fees | |||||
| $ | 149,000 | ||||
| ** | This award is made pursuant to the 2003 Stock Incentive Plan at the Annual Board meeting date, which immediately follows the annual shareholders’ meeting. All restrictions lapse immediately and the number of shares for this award is determined based upon the average of the high and low company stock price on that date, in accordance with the plan. |
The following table shows the total compensation actually paid to each non-employee Director in 2010:
2011:
| Name | Fees Earned or Paid in Cash ($) | Stock Awards(1) ($) | Total ($) | |||||||||
| Brian E. Barents | $ | 75,000 | $ | 52,090 | $ | 127,090 | ||||||
| E. Reeves Callaway III | $ | 72,000 | $ | 52,090 | $ | 124,090 | ||||||
| Karen M. Garrison | $ | 80,350 | $ | 52,090 | $ | 132,440 | ||||||
| A. William Higgins | $ | 60,000 | $ | 52,090 | $ | 112,090 | ||||||
| Edwin A. Huston | $ | 90,900 | $ | 52,090 | $ | 142,990 | ||||||
| Eileen S. Kraus | $ | 111,750 | $ | 52,090 | $ | 163,840 | ||||||
| George E. Minnich | $ | 73,500 | $ | 52,090 | $ | 125,590 | ||||||
| Thomas W. Rabaut | $ | 70,500 | $ | 52,090 | $ | 122,590 | ||||||
| Richard J. Swift | $ | 81,050 | $ | 52,090 | $ | 133,140 | ||||||
| Name | Fees Earned or Paid in Cash ($) | Stock Awards(1) ($) | Total ($) | |||||||||
| Brian E. Barents | $ | 70,500 | $ | 80,010 | $ | 150,510 | ||||||
| E. Reeves Callaway III | $ | 64,500 | $ | 80,010 | $ | 144,510 | ||||||
| Karen M. Garrison | $ | 72,200 | $ | 80,010 | $ | 152,210 | ||||||
| A. William Higgins | $ | 61,500 | $ | 80,010 | $ | 141,510 | ||||||
| Eileen S. Kraus | $ | 107,700 | $ | 80,010 | $ | 187,710 | ||||||
| George E. Minnich | $ | 80,637 | $ | 80,010 | $ | 160,647 | ||||||
| Thomas W. Rabaut | $ | 69,000 | $ | 80,010 | $ | 149,010 | ||||||
| Richard J. Swift | $ | 77,500 | $ | 80,010 | $ | 157,510 | ||||||
| (1) | Please refer to Footnote |
2011.
guidelines.
Kaman Corporation web site atwww.kaman.com using the tab "About Kaman", then selecting “Contact Information”Kaman - General Inquiries” and then choosing the “Corporate Secretary’s Office”
| Name | Number of Shares Beneficially Owned as of February 1, 2011 | Percentage | ||||||
| Brian E. Barents | 15,500 | * | ||||||
| E. Reeves Callaway III | 10,500 | * | ||||||
| Candace A. Clark | 52,684 | (1) | * | |||||
| William C. Denninger | 32,421 | (2) | * | |||||
| Karen M. Garrison | 10,000 | * | ||||||
| A. William Higgins | 4,000 | * | ||||||
| Edwin A. Huston | 13,500 | * | ||||||
| Neal J. Keating | 139,361 | (3) | * | |||||
| Eileen S. Kraus | 18,499 | * | ||||||
| George E. Minnich | 4,000 | * | ||||||
| Thomas W. Rabaut | 10,400 | * | ||||||
| Steven J. Smidler | 2,100 | * | ||||||
| Gregory L. Steiner | 39,816 | (4) | * | |||||
| Richard J. Swift | 11,000 | * | ||||||
| All Directors and Executive Officers as a group | 434,506 | (5) | 1.67 | % | ||||
| Name | Number of Shares Beneficially Owned as of February 1, 2012 | Percentage | |||||
| Brian E. Barents | 17,673 | * | |||||
| E. Reeves Callaway III | 12,673 | * | |||||
| Candace A. Clark | 46,706 | (1) | * | ||||
| William C. Denninger | 63,397 | (2) | * | ||||
| Karen M. Garrison | 12,173 | * | |||||
| A. William Higgins | 6,173 | * | |||||
| Neal J. Keating | 153,353 | (3) | * | ||||
| Eileen S. Kraus | 21,043 | * | |||||
| George E. Minnich | 6,269 | * | |||||
| Thomas W. Rabaut | 12,573 | * | |||||
| Steven J. Smidler | 14,774 | (4) | * | ||||
| Gregory L. Steiner | 56,443 | (5) | * | ||||
| Richard J. Swift | 13,173 | * | |||||
| All Directors and Executive Officers as a group | 514,528 | (6) | 1.94 | % | |||
| * | Less than one percent. |
| (1) | Includes |
| (2) | Includes |
| (3) | Includes 14,000 shares held in a trust of which Mr. Keating and his spouse are trustees. |
| (4) | Includes |
| (5) | Includes 27,406 shares subject to stock options exercisable or which will become exercisable within 60 days, |
| (6) |
Beneficial Owners Of More Than 5% Of Common Stock
| Name and Address of Beneficial Owner | Number of Shares Beneficially Owned | Percentage of Common Stock | ||||||
| Gabelli Funds, LLC(1) | 3,583,862 | 13.7 | % | |||||
| One Corporate Center Rye, NY 10580 | ||||||||
| BlackRock, Inc. f/k/a Barclays Global Investors, N.A.(2) | 2,024,951 | 7.8 | % | |||||
| 40 East 52nd Street New York, NY 10022 | ||||||||
| FMR LLC(3) | 1,430,849 | 5.5 | % | |||||
| 82 Devonshire Street Boston, MA 02109 | ||||||||
| T. Rowe Price Associates, Inc.(4) | 1,379,121 | 5.3 | % | |||||
| 100 East Pratt Street Baltimore, MD 21202 | ||||||||
| Name and Address of Beneficial Owner | Number of Shares Beneficially Owned | Percentage of Common Stock | ||||
Gabelli Funds, LLC(1) | 3,897,804 | 14.7 | % | |||
One Corporate Center Rye, NY 10580 | ||||||
BlackRock, Inc.(2) | 2,153,888 | 8.1 | % | |||
40 East 52nd Street New York, NY 10022 | ||||||
The London Company(3) | 1,524,077 | 5.7 | % | |||
1801 Bayberry Court, Suite 301 Richmond, VA 23226 | ||||||
T. Rowe Price Associates, Inc.(4) | 1,389,961 | 5.2 | % | |||
100 East Pratt Street Baltimore, MD 21202 | ||||||
| (1) | As reported on Amendment No. |
| (2) | As reported on Amendment No. 2 to Schedule 13G filed with the SEC on February 10, 2012. |
| (3) | As reported on Amendment No. 1 to Schedule 13G filed with the SEC on February |
| (4) | As reported on Amendment No. 1 to Schedule 13G filed with the SEC on February |
EXECUTIVE COMPENSATION
Compensation Discussion and Analysis
Executive Summary
This section explains our executive compensation program as it applies to our named executive officers (whose compensation information is contained in the tables following this discussion) as well as the role, responsibilities and philosophy of our Board’s Personnel & Compensation Committee (the “Committee” or the “committee”), which oversees the design and operation of the program. The named executive officers are:

Neal J. Keating Chairman, President and Chief Executive Officer William C. Denninger SeniorExecutive Vice President and Chief Financial OfficerGregory L. Steiner Executive Vice President, Kaman Corporation and President, Kaman Aerospace Group, Inc. Steven J. Smidler Executive Vice President, Kaman Corporation and President, Kaman Industrial Technologies Corporation Candace A. Clark Senior Vice President, Chief Legal Officer and Secretary
| Neal J. Keating | Chairman, President and Chief Executive Officer | |
| William C. Denninger | ||
| Gregory L. Steiner | Executive Vice President, Kaman Corporation and President, Kaman Aerospace Group, Inc. | |
| Steven J. Smidler | Executive Vice President, Kaman Corporation and President, Kaman Industrial Technologies Corporation | |
| Candace A. Clark | Senior Vice President, Chief Legal Officer and Secretary | |
Increase shareholder value by motivating talented individuals to achieve the company’s annual and longer-term financial and strategic operational goals with compensation related to objective benchmarks and company performance. To do this, we use a mix of pay elements, including salary, annual and long-term incentive opportunities and benefits, which we believe results in an appropriate balance among salary, incentive compensation and benefits. Overall, salary and benefits are determined based upon comparison to the competitive market for our 16 executives and a group of the Russell 2000 index companies that approximate our revenue size while the annual and long-term incentive opportunities are directly related to the company’s financial performance compared to the Russell 2000 index companies. Have a significant percentage of our senior executives’ incentive compensation tied to successful execution of strategic operational goals. To accomplish this, we establish objective and measurable goals on an annual and longer-term (3 years) basis and compare actual performance to objective, measurable benchmarks, as described above. As a result, executives, especially the named executive officers, earn above average compensation when the company achieves above average financial performance compared to the Russell 2000 index of companies. Have our named executive officers maintain a significant equity stake in the company to further align their interests with those of our shareholders. We maintain meaningful stock ownership guidelines and require that up to 1/3 of a cash long term incentive award payment be paid in stock if the company’s stock ownership guidelines have not been attained by a named executive officer. Protect against inappropriate risk taking. We use caps on potential awards for both annual and long-term incentives. The Committee also introduced a claw back policy in 2010 applicable to the company's Chief Executive Officer and Chief Financial Officer, and Messrs. Keating's and Denniger's employment agreements were amended to reflect the policy. We will establish a comprehensive claw back policy for all named executive officers when SEC regulations are issued in final form to provide guidance on the requirements for a comprehensive claw back policy pursuant to the requirements of the Dodd-Frank Act. This policy will immediately apply to all named executive officers as their employment agreements currently provide that each executive is bound by any claw back policy adopted by the company. In February 2011, the Committee also recommended, and the Board adopted, an anti-hedging policy which provides that no director or executive officer may speculate in company stock or debt securities, including hedging or any type of arrangement that would have a similar economic effect. Assure that the benefits provided to the named executive officers are consistent with practices of similar companies and also aligned with shareholder interests. To accomplish this, we have made the following changes:
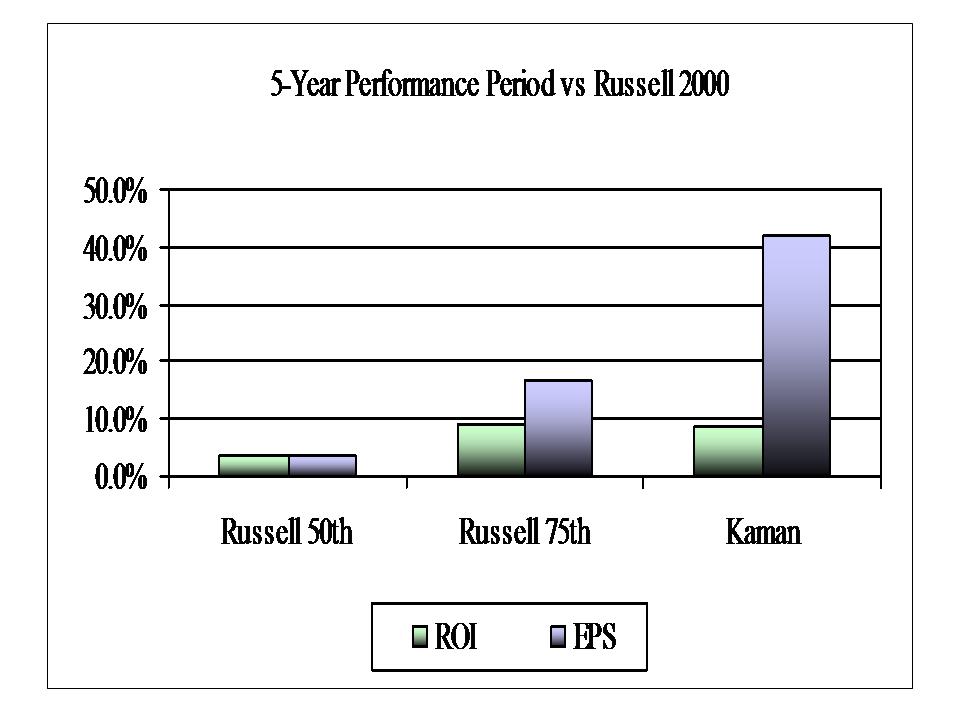
At the 2011 annual meeting, we asked shareholders to provide a non-binding advisory vote on our recommended executive compensation program ("Say on Pay" vote) and the frequency at which such an advisory vote on pay should occur (“Say on Frequency" vote). The Committee reviewed the results of the vote and concluded that the majority of shareholders agreed with our recommended executive compensation program last year with nearly 95% of votes cast in favor of the Board's recommendation if abstention votes and broker non-votes are disregarded.(1) Shareholders also overwhelmingly supported our recommendation regarding the Say on Frequency vote, which we proposed occur on an annual basis. Approximately 92% of the votes cast were in favor of the Board's recommendation if abstention votes and broker non-votes are disregarded.(2) On April 27, 2011, the company filed a Form 8-K reporting the results of the 2011 advisory votes on the Say on Pay and Say on Frequency proposals.(3) In considering the outcome of the 2011 advisory voting, the Committee interpreted the results to mean that the vast majority of shareholders agree with the company's executive compensation program. As such, the Committee took no action to modify the executive compensation program as a result of the vote. We encourage shareholders to review this Compensation Discussion and Analysis and the accompanying compensation tables for a thorough explanation of our approach to executive compensation and how our named executive officers’ actual pay has correlated with the company’s financial performance. As we discuss herein, we believe that the compensation paid to our named executive officers for 2011 bears a direct and corresponding relationship to the company’s 2011 financial performance. 17 _____________ (1) Shares were voted as follows with respect to the Say on Pay proposal in 2011: 17,704,576 shares voted in favor; 971,039 shares votes against; 4,024,364 shares abstaining; and 1,811,230 broker non-votes. If abstention votes were counted as votes against the Board's Say on Pay recommendation and broker non-votes are disregarded, then this would amount to approximately 78% of the votes cast approving the Board's recommendation. (2) Shares were voted as follows with respect to the Say on Frequency proposal in 2011: 17,086,322 shares voted in favor of an annual vote requirement; 37,509 shares were voted in favor of a 2-year voting frequency; 1,475,884 shares were voted in favor of a 3-year voting frequency. There were 4,100,264 shares abstaining and 1,811,230 broker non-votes. If abstention votes were counted as votes against the Board's Say on Frequency recommendation and broker non-votes are disregarded, then this would amount to approximately 75% of the votes cast approving the Board's recommendation. (3) A copy of this Form 8-K filing may be accessed on the company's website at www.kaman.com by first clicking on the "Investor Relations" link, followed by the "Financial Information" link and then clicking on the "SEC Filings" link. Under the filing date column, scroll to the 4/27/11 entry and then click on the format type in which you want to view the Form 8-K . The Pay Elements; Performance Metrics and Evaluation of Market Pay Practices We have designed our executive compensation program to achieve these goals in a variety of ways with the intention of providing reasonable pay for a company of our size and incentive opportunities that challenge and correspondingly reward our executives when, and to the extent that, the company succeeds. First, we use a combination of pay elements, each of which over time is intended to approximate the market median compensation for each position. These elements include base salary, annual and longer-term cash incentive opportunities, and benefits. The opportunities afforded by each pay element are determined on the basis of comparison to objective criteria to assure consistency with companies of similar revenue size, which include national surveys and a sampling of the Russell 2000 companies recommended by the Committee’s independent consultant which approximate the company’s revenue size (but is not reflective of our unique combination of business segments in one organization). Actual annual and longer-term incentive pay is then determined by comparing selected metrics of company financial and operational performance to the entire Russell 2000 index of companies. The Committee uses the Russell 2000 because it believes that this continues to be the most likely group that both current and potential shareholders would use to evaluate the company in making their investment decisions; this is largely due to the fact that our two business segments (Aerospace and Industrial Distribution) are so diverse from each other that it is not feasible to compare us to a peer group of companies. The Committee regularly reviews the continued appropriateness of using the Russell 2000 for comparison and has reconfirmed its use for 2012. The financial performance metrics upon which annual and longer-term incentive opportunities are based are those that management uses to evaluate business performance. For corporate participants, annual incentive metrics include return on investment, growth in earnings per share, and growth in earnings per share compared to the company’s annual plan projection for earnings per share; for business segment participants, metrics include accomplishment of predetermined financial goals and other operational performance factors approved by the Committee. Longer-term incentive metrics are the same for corporate and business segment executives and consist of the company’s average return on investment, compounded growth in earnings per share and total return to shareholders over a three-year period. The weightings of these metrics in the overall determination of award payments differ for the annual cash incentive and longer-term incentive, as discussed below. As discussed below, during the past few years, the Committee has taken a number of steps to assure that the benefits provided to the named executive officers more closely approximate the benefits that are provided to other employees. These include the elimination of essentially all perquisites and phase out of the supplemental employees’ retirement plan in the same manner as the basic tax-qualified pension plan. In addition, the Committee has also aligned existing employment and change-in-control agreements for the named executive officers with current market practices. The Committee also amended the Stock Incentive Plan in February 2012 to prohibit the company from reducing the exercise price of awarded stock options or stock appreciation rights (“SARs”). The amendment also prohibits the cancellation of an outstanding option or SAR award in exchange for cash or another award having an exercise price less than the fair market value of the original awarded option or SAR. The only exception is in connection with a corporate transaction that includes, for example, a stock or cash dividend, stock split, recapitalization, reorganization, merger, consolidation or an exchange of shares.18 How the Pay Elements Work in Practice The pay elements of our executive compensation program are designed to work together in a way that results in above average compensation when the company achieves above average financial performance compared to the Russell 2000 index of companies. Set forth below are charts comparing our performance to the 50th and 75th percentiles of our market (as described above) for both annual and long-term incentive award determination purposes. Annual Cash Incentive Awards. This chart compares our
 In calculating the 2011 award percentage under our annual cash incentive plan, the Committee considered the company's actual financial results for 2011, which included the effects of a pension accounting change (described herein at page 26) and excluded from financial performance the impact of the costs related to acquisitions in 2011. This resulted in an annual incentive performance award factor of 173.3% of the target award. The exclusion of acquisition costs reflects the Committee's views that acquisitions are of vital importance to the company's long-term growth and that management should be encouraged to pursue acquisitions when appropriate. If these adjustments had not been made, the performance award factor would have been 171.3%. In connection with establishing the 2011 performance goals under the annual cash incentive award plan, the Committee reserved the authority to include the impact of the pension accounting change and exclude acquisition costs from the 2011 plan performance metrics within the first 90 days of 2011. Our 19 officers at companies having similar revenue, as illustrated by the chart below:
 Please see the discussion at page Performance Related to Long-Term Incentive Award Determination. The following chart compares the Company’s three year
 20 _______________ * Three-year average return on investment ** Average annual compounded growth in earnings per share *** Three-year total return to shareholders In addition, each of the other named executive officers’ target performance-based compensation (which is comprised of annual cash incentive and LTIP) was at least 2011. Our emphasis on goal achievement to drive incentive compensation is balanced by policies and plan features that emphasize alignment of the executive’s financial interest with those of company’s shareholders. These include the existence of stock ownership guidelines, the long-term incentive feature of the Stock Incentive Plan that requires executives to receive at least one-third of an award payment in company stock if stock ownership guidelines have not been met, and caps imposed upon total annual cash incentives and cash-based long-term incentive awards. In February 2011, the The Committee also introduced a claw back policy in 2010 applicable to the company’s CEO and chief financial officer, and Messrs. Keating and Denninger’s employment agreements were amended Actions to Modify Supplemental Pension/Perquisites/Management Agreements The Committee has modified the supplemental pension plan, perquisites and management agreements provided to our named executive officers over the past few years consistent with market practice as follows: Phase Out of Pension Plan and Supplemental Retirement Plan. In early 2010, the Board closed the defined benefit pension plan to new hires and implemented a phase out plan for additional service and compensation to be included to determine benefit levels and service credits. At the same time, the Board determined that the supplemental retirement plan which applies to the named executive officers should also be phased out in the same manner to provide a consistent approach to all employees. (Mr. Smidler was not a participant in either plan because the Industrial Distribution segment had closed the pension plan to new hires in mid-2009.) Perquisites. Perquisites that were available to the named executive officers and other executives were eliminated for the named executive officers in 2010, including medical expense reimbursement (up to $5,000 per year), tax and estate planning reimbursement (up to $10,000 per year) and the leased vehicle policy was converted to a vehicle allowance. Starting in 2012, named executives are eligible to receive a company-paid annual physical examination by a physician selected by the company. This program is in the company's interests because it helps us to address business continuity and succession planning matters. There are no other perquisites or similar personal benefits provided to the named executive officers. Changes in Employment and Change in Control Agreements. The Board believes that employment arrangements for top senior executives are an important tool for the attraction and retention of skilled management in the company’s two very competitive industries of aerospace and industrial distribution. Therefore, each of the named executive officers has an employment agreement and a change in control agreement (collectively the “management agreements”). Over time, the committee has modified the management agreements in accordance with the advice of its independent consultant to reflect current market practices. In early 2010, the Committee notified the company’s executive officers that in the event their management agreements were renewed, it did not intend to provide an excise tax gross-up benefit. 21 The Committee also determined in 2010 that upon renewal, all employment agreements would be modified to provide that the Committee may approve a retirement date prior to age 65 but not earlier than age 62 in order to assure that shareholder interests are served in the appropriate timing of senior executive succession in the future. The Company believes that other provisions of the named executive officers’ management agreements are already consistent with market practices, including the existence of a so-called “double trigger” in order to receive severance payments upon a change of
9. | |||||||||||||||||||||||||||||||||||||||||||||||||||||||||||||||||||||||||||||||||||||||||||||||||||||||||||||||||||||||||||||||||||||||||||||||||||||||||||||||||||||||||||||||||||||||||||||||||||||||||||||||||||||||||||||||||||||||||||||||||||||||||||||||||||||||||||||||||||||||||||||||||||||||||||||||||||||||||||||||||||||||||||||||||||||||||||||||||||||||||||||||||||||||||||||||||||||||||||||||||||||||||||||||||||||||||||||||||||||||||||||||||||||||||||||||||||||||||||||||||||||||||||||||||||||||||||||||||||||||||||||||||||||||||||||||||||||||||||||||||||||||||||||||||||||||||||||||||||||||||||||||||||||||||||||||||||||||||||||||||||||||||||||||||||||||||||||||||||||||||||||||||||||||||||||||||||||||||||||||||||||||||||||||||||||||||||||||||||||||||||||||||||||||||||||||||||||||||||||||||||||||||||||||||||||||||||||||||||||||||||||||||||||||||||||||||||||||||||||||||||||||||||||||||||||||||||||||||||||||||||||||||||||||||||||||||||||||||||||||||||||||||||||||||||||||||||||||||||||||
![[GRAPHIC MISSING]](https://capedge.com/proxy/DEF 14A/0001144204-11-011585/b211797_chrt5yearperform.jpg)
![[GRAPHIC MISSING]](https://capedge.com/proxy/DEF 14A/0001144204-11-011585/b211797_chrt-ceobase.jpg)
![[GRAPHIC MISSING]](https://capedge.com/proxy/DEF 14A/0001144204-11-011585/b211797_chrt3yearperform.jpg)
| Neal J. Keating(1) | Base Salary | Target Annual Cash Incentive Award % | ||||||
| Market Median | $ | 795,000 | 100 | % | ||||
| Kaman | $ | 725,000 | 100 | % | ||||
| William C. Denninger(1) | Base Salary | Target Annual Cash Incentive Award % | ||||||
| Market Median | $ | 376,000 | 60 | % | ||||
| Kaman | $ | 478,200 | 60 | % | ||||
| Gregory L. Steiner(2) | Base Salary | Target Annual Cash Incentive Award % | ||||||||||||
Neal J. Keating(1) | Base Salary | Target Annual Cash Incentive Award % | ||||||||||||
| Market Median | $ | 429,600 | 60 | % | $ | 847,000 | 100 | % | ||||||
| Kaman | $ | 371,725 | 60 | % | $ | 800,000 | 100 | % | ||||||
| Steven J. Smidler(2) | Base Salary | Target Annual Cash Incentive Award % | ||||||
| Market Median | $ | 335,600 | 48 | % | ||||
| Kaman | $ | 330,000 | 55 | % | ||||
| Candace A. Clark(2) | Base Salary | Target Annual Cash Incentive Award % | ||||||||||||
William C. Denninger(1) | Base Salary | Target Annual Cash Incentive Award % | ||||||||||||
| Market Median | $ | 332,400 | 50 | % | $ | 432,400 | 65 | % | ||||||
| Kaman | $ | 374,170 | 50 | % | $ | 492,540 | 60 | % | ||||||
Gregory L. Steiner(2) | Base Salary | Target Annual Cash Incentive Award % | ||||
| Market Median | $ | 385,200 | 63 | % | ||
| Kaman | $ | 382,875 | 60 | % | ||
Steven J. Smidler(2) | Base Salary | Target Annual Cash Incentive Award % | ||||
| Market Median | $ | 344,800 | 58 | % | ||
| Kaman | $ | 330,000 | 55 | % | ||
Candace A. Clark(2) | Base Salary | Target Annual Cash Incentive Award % | ||||
| Market Median | $ | 355,400 | 58 | % | ||
| Kaman | $ | 385,400 | 50 | % | ||
| (1) | The market median figures for Messrs. Keating and Denninger are based upon the surveys and the sample of Russell 2000 companies referenced above. |
| (2) | The market median figures for Messrs. Steiner and Smidler and Ms. Clark are based upon the surveys because these positions are not typically shown separately in the proxy statements of the sample Russell 2000 companies. |
Based
their positions.
targets, the annualized value of long-term incentive targets and retirement income formulas are applied to actual annual base salaries, total compensation levels may similarly differ from market median total compensation levels.
| Fixed | Performance-Based* | |||||||||||
| Name | Salary (% of Total) | Annual Cash Incentive (% of Total) | Long-Term Incentive (% of Total) | Total Performance Related (% of Total) | ||||||||
| Neal J. Keating | 25 | % | 25 | % | 50 | % | 75 | % | ||||
| William C. Denninger | 36 | % | 22 | % | 42 | % | 64 | % | ||||
| Gregory L. Steiner | 36 | % | 22 | % | 42 | % | 64 | % | ||||
| Steven J. Smidler | 38 | % | 21 | % | 42 | % | 63 | % | ||||
| Candace A. Clark | 39 | % | 20 | % | 41 | % | 61 | % | ||||
| Fixed | Performance-Based* | |||||||||||||||
| Name | Salary (% of Total) | Annual Cash Incentive (% of Total) | Long-Term Incentive (% of Total) | Total Performance Related (% of Total) | ||||||||||||
| Neal J. Keating | 25 | % | 25 | % | 50 | % | 75 | % | ||||||||
| William C. Denninger | 36 | % | 22 | % | 42 | % | 64 | % | ||||||||
| Gregory L. Steiner | 36 | % | 22 | % | 42 | % | 64 | % | ||||||||
| Steven J. Smidler | 67 | % | 33 | % | 0 | % | 33 | % | ||||||||
| Candace A. Clark | 39 | % | 20 | % | 41 | % | 61 | % | ||||||||
Allocation of 2009 Total Cash and Stock-based Compensation
| Fixed | Performance-Based* | |||||||||||||||
| Name | Salary (% of Total) | Annual Cash Incentive (% of Total) | Long-Term Incentive (% of Total) | Total Performance Related (% of Total) | ||||||||||||
| Neal J. Keating | 29 | % | 24 | % | 47 | % | 71 | % | ||||||||
| William C. Denninger | 41 | % | 20 | % | 39 | % | 59 | % | ||||||||
| Gregory L. Steiner | 41 | % | 20 | % | 39 | % | 59 | % | ||||||||
| Steven J. Smidler | 67 | % | 33 | % | 0 | % | 33 | % | ||||||||
| Candace A. Clark | 41 | % | 20 | % | 39 | % | 59 | % | ||||||||
| Fixed | Performance-Based* | |||||||||||
| Name | Salary (% of Total) | Annual Cash Incentive (% of Total) | Long-Term Incentive (% of Total) | Total Performance Related (% of Total) | ||||||||
| Neal J. Keating | 25 | % | 25 | % | 50 | % | 75 | % | ||||
| William C. Denninger | 36 | % | 22 | % | 42 | % | 64 | % | ||||
| Gregory L. Steiner | 36 | % | 22 | % | 42 | % | 64 | % | ||||
| Steven J. Smidler | 67 | % | 33 | % | — | % | 33 | % | ||||
| Candace A. Clark | 39 | % | 20 | % | 41 | % | 61 | % | ||||
| * | Percentages are based on target performance for the annual cash incentive and the long-term incentive elements of compensation. |
Components of the Executive Compensation Program
The total compensation program for our named executive officers has consisted of the following elements:Base Salaries;Annual Cash Incentive Awards;Long-Term Incentives;Retirement and Other Benefits
surveys of anticipated salary increases published by Towers Watson, Mercer, CompData Surveys, and World at Work. Within the overall budget guideline, a narrow range of salary adjustment percentages is then established for each salary grade, with slightly higher percentages for individuals who are below the grade midpoint and slightly lower percentages for individuals who are above the grade midpoint. Salary adjustments, if any, are then determined within this narrow range based upon an annual performance rating given to the named executive officer by Mr. Keating and recommended to the Committee. The performance rating determination is primarily based upon the officer’s level of substantive performance in executing each category of responsibilities as described in his or her position description.
2011.
| Named Executive Officer | 2011 Target Award Opportunity Expressed as % of Base Salary | |||
| Neal J. Keating | ||||
| William C. Denninger | ||||
| Gregory L. Steiner | ||||
| Steven J. Smidler | ||||
| Candace A. Clark | ||||
2010Measures.
| Performance Measure | Benchmark | Weighting | ||
| Actual return on investment | Russell 2000 index for | 33% | ||
| Growth in earnings per share (fully diluted) | Russell 2000 index for | 33% | ||
| Actual earnings per share (fully diluted) | 34% | |||
Performance.
For 2011, the Committee based annual incentive awards on the company's actual performance for 2011, which included the effects of the pension accounting change and excluded the impact of the costs related to acquisitions occurring in 2011. The following tables show the relationship between the company’sBenchmark 5 Year Russell 2000 Performance — 20052006 – 2009
2010| 25th Percentile | Median | 75th Percentile | ||||||||||
| Compounded EPS Growth | -8.4 | % | 4.3 | % | 18.1 | % | ||||||
| Average Return on Investment | -2.5 | % | 4.2 | % | 9.5 | % | ||||||
| Earnings per Share (fully diluted) | ||||||||||||
| 2009 Actual | 2010 Plan | 2010 Actual | ||||||||||
| $ | 1.27 | $ | 1.51 | $ | 1.47 | |||||||
| 25th Percentile | Median | 75th Percentile | ||||||
| Compounded EPS Growth | (8.9 | )% | 3.7 | % | 16.5 | % | ||
| Average Return on Investment | (4.3 | )% | 3.4 | % | 8.9 | % | ||
| 2010 Actual Results | Median Return For Prior 5-Year Period — Russell 2000 | Percentage Of Factor Earned | Weighting Factor | % Of Target Award* | ||||||||||||||||
| Return on Investment | 7.5 | % | 4.2 | % | 162.3 | % | 33 | 53.5 | % | |||||||||||
| Growth In Earning per share | 15.7 | % | 4.3 | % | 182.6 | % | 33 | 60.3 | % | |||||||||||
| Actual versus projected Earnings per share performance | 97.4 | % | N/A | 94.8 | % | 34 | 32.2 | % | ||||||||||||
| Corporate Performance Factor | 146.0 | % | ||||||||||||||||||
| Earnings per Share (fully diluted) | |||||||||||||
| 2010 Actual | 2011 Plan | 2011 Actual | 2011 Modified | ||||||||||
| $ | 1.36 | * | $ | 1.80 | $ | 1.93 | $ | 1.96 | |||||
2011 Actual Results* | Median Return For Prior 5-Year Period — Russell 2000 | Percentage Of Factor Earned | Weighting Factor | % Of Target Award** | ||||||||||
| Return on Investment | 10.4 | % | 3.4 | % | 200.0 | % | 33 | 66.0 | % | |||||
| Growth In Earning per share | 44.1 | % | 3.7 | % | 200.0 | % | 33 | 66.0 | % | |||||
| Actual versus projected Earnings per share performance | 108.9 | % | N/A | 121.4 | % | 34 | 41.3 | % | ||||||
| Corporate Performance Factor | 173.3 | % | ||||||||||||
| Modified Earnings: | In Millions | Per Diluted Share | ||||||
| Reported Earnings | $ | 51.1 | $ | 1.93 | ||||
| Earnings from Acquisitions | 0.2 | 0.01 | ||||||
| Acquisition Costs, net of tax | 0.6 | 0.02 | ||||||
| Net Adjustments to Earnings | $ | 0.08 | $ | 0.03 | ||||
| Modified Earnings | $ | 51.9 | $ | 1.96 | ||||
| Modified Invested Capital: | ||||||||
| Reported Shareholders' Equity | $ | 373.1 | ||||||
| Total Reported Debt | 205.2 | |||||||
| Total Reported Invested Capital | 578.3 | |||||||
| Acquisition Costs, net of tax | $ | 0.6 | ||||||
| Investment in 2011 Acquisitions | $ | (82.5 | ) | |||||
| Modified Invested Capital | $ | 496.4 | ||||||
Performance.
Mr. Keating’s degree of individual goal attainment was determined by the Committee and the Board against specific measurable written goals established early in the year by the Board for his role as CEO and Chairman.Payments. 20102011 Annual Cash Incentive Award Payments20102011 for the Corporate named executive officers:![]()
![]()
![]()
Named Executive Officer 2010 Cash
Incentive
Award Incentive Award
Expressed as a
Percentage of
Base SalaryNeal J. Keating $ 1,094,750 151.0 % William C. Denninger $ 444,726 93.0 % Candace A. Clark $ 289,982 77.5 % Named Executive Officer Neal J. Keating $ 1,450,400 181.3 % William C. Denninger $ 535,785 108.8 % Candace A. Clark $ 353,219 91.7 % 20102011 annual cash incentive award for Mr. Steiner, president of the Aerospace segment, was calculated based on (i) predetermined financial goals for this business segment as recommended by the CEO and adopted by the committee; and (ii) performance relative to other factors described below. The financial goals and their weighting for this business segment were:![]()
![]()
![]()
Performance Goal Benchmark Weighting BudgetedPlan return on investment Target return on investment 20% Actual return on investment BudgetedPlan return on investment 20% Actual return on investment Target return on investment 40% Growth in segment operating income year over year Operating income 20%
Following is a conversion chart demonstrating how the total number of points is converted into a percentage of the target award:
| CONVERSION CHART EXAMPLE | ||||||||
| Total Points Earned | Percent of Target Award Earned | |||||||
| Below 50 | 0 | |||||||
| 50 | 20 | |||||||
| 60 | 30 | |||||||
| 70 | 45 | |||||||
| 80 | 60 | |||||||
| 90 | 80 | |||||||
| 100 | 100 | |||||||
| 110 | 120 | |||||||
| 120 | 140 | |||||||
| 130 | 160 | |||||||
| 140 | 180 | |||||||
| 150 & Above | 200 | |||||||
| CONVERSION CHART EXAMPLE | ||
Total Points Earned | Percent of Target Award Earned | |
| Below 50 | — | |
| 50 | 20 | |
| 60 | 30 | |
| 70 | 45 | |
| 80 | 60 | |
| 90 | 80 | |
| 100 | 100 | |
| 110 | 120 | |
| 120 | 140 | |
| 130 | 160 | |
| 140 | 180 | |
| 150 & Above | 200 | |
| Average Return on Investment (“ROI”) | Operating Income (in millions) | |||||||||||||||||||
| 2010 Target | 2010 Plan | 2010 Actual | 2009 | 2010 | ||||||||||||||||
| 21.5 | % | 23.9 | % | 18.1 | % | $ | 75.0 | $ | 67.2 | |||||||||||
| Performance % | Points Earned | Performance Range | ||||||||||||||||||
| Plan vs. Target ROI | 111.2 | % | 28.9 | 50% = 0 | 100% = 20 | 125% = 40 | ||||||||||||||
| Actual Performance vs Plan ROI | 75.5 | % | 10.2 | 50% = 0 | 100% = 20 | 125% = 40 | ||||||||||||||
| Actual Performance vs Target ROI | 84.0 | % | 27.2 | 50% = 0 | 100% = 40 | 125% = 80 | ||||||||||||||
| Growth in Operating Income | -10.5 | % | — | 0% = 0 | 8% = 20 | 12% = 40 | ||||||||||||||
| Points Earned based on Financial Performance | 66.3 | |||||||||||||||||||
| Other Factors (20 point maximum) | 11.0 | |||||||||||||||||||
| Total Points Earned | 77.3 | |||||||||||||||||||
Average Return on Investment (“ROI”) Operating Income(in millions) 2011 Target 2011 Plan 2011 Actual 2010 2011 18.5 % 25.0 % 20.5 % $ 67.2
$ 80.4
| Performance % | Points Earned | Performance Range | |||||||||
| Plan vs. Target ROI | 135.1 | % | 40.0 | 50% = 0 | 100% = 20 | 125% = 40 | |||||
| Actual Performance vs Plan ROI | 82.0 | % | 12.8 | 50% = 0 | 100% = 20 | 125% = 40 | |||||
| Actual Performance vs Target ROI | 110.8 | % | 57.3 | 50% = 0 | 100% = 40 | 125% = 80 | |||||
| Growth in Operating Income | 19.8 | % | 40.0 | 0% = 0 | 8% = 20 | 12% = 40 | |||||
| Points Earned based on Financial Performance | 150.1 | ||||||||||
| Other Factors (20 point maximum) | 9.0 | ||||||||||
| Total Points Earned | 159.1 | ||||||||||
Payments.
Following is the total annual cash incentive award earned for calendar year| Named Executive Officer | 2010 Cash Incentive Award | Incentive Award Expressed as a Percentage of Base Salary | ||||||
| Gregory L. Steiner | $ | 124,899 | 33.6 | % | ||||
A special one-time discretionary bonus of approximately $44,000 was also awarded to
| Named Executive Officer | 2011 Cash Incentive Award | Incentive Award Expressed as a Percentage of Base Salary | |||||
| Gregory L. Steiner | $ | 459,450 | 120 | % | |||
addition to his current position of President, Kaman Aerospace Group, Inc.
| Performance Goal | Benchmark | Weighting | ||
| Target return on investment | 15% | |||
| Actual return on investment | 15% | |||
| Actual return on investment | Target return on investment | 30% | ||
| Growth in segment operating income year over year | Operating income | 20% | ||
| Growth in sales year over year | Sales | 20% | ||
Following is a conversion chart demonstrating how the total number of points is converted into a percentage of the target award:
| CONVERSION CHART EXAMPLE | ||||||||
| Total Points Earned | Percent of Target Award Earned | |||||||
| Below 50 | 0 | |||||||
| 50 | 20 | |||||||
| 60 | 30 | |||||||
| 70 | 45 | |||||||
| 80 | 60 | |||||||
| 90 | 80 | |||||||
| 100 | 100 | |||||||
| 110 | 120 | |||||||
| 120 | 140 | |||||||
| 130 | 160 | |||||||
| 140 | 180 | |||||||
| 150 & Above | 200 | |||||||
| CONVERSION CHART EXAMPLE | |
Total Points Earned | Percent of Target Award Earned |
| Below 50 | — |
| 50 | 20 |
| 60 | 30 |
| 70 | 45 |
| 80 | 60 |
| 90 | 80 |
| 100 | 100 |
| 110 | 120 |
| 120 | 140 |
| 130 | 160 |
| 140 | 180 |
| 150 & Above | 200 |
| Sales (in millions) | Average Return on Investment (“ROI”) | Operating Income (in millions) | ||||||||||||||||||||||
| 2009 | 2010 | 2010 Target | 2010 Plan | 2010 Actual | 2009 | 2010 | ||||||||||||||||||
| $645.6 | $ | 832.2 | 18.7 | % | 13.0 | % | 15.9 | % | $ | 12.6 | $ | 30.3 | ||||||||||||
| Performance % | Points Earned | Performance Range | ||||||||||||||||||
| Plan vs. Target ROI | 69.6 | % | 5.9 | 50% = 0 | 100% = 15 | 125% = 30 | ||||||||||||||
| Actual Performance vs Plan ROI | 122.3 | % | 28.4 | 50% = 0 | 100% = 15 | 125% = 30 | ||||||||||||||
| Actual Performance vs Target ROI | 85.1 | % | 21.1 | 50% = 0 | 100% = 30 | 125% = 60 | ||||||||||||||
| Growth in Operating Income | 139.9 | % | 40.0 | 0% = 0 | 8% = 20 | 12% = 40 | ||||||||||||||
| Growth in Sales | 28.9 | % | 40.0 | 0% = 0 | 8% = 20 | 16% = 40 | ||||||||||||||
| Points Earned based on Financial Performance | 135.4 | |||||||||||||||||||
| Other Factors (80 point maximum) | 68.0 | |||||||||||||||||||
| Total Points Earned | 203.4 | |||||||||||||||||||
Sales (in millions) | Average Return on Investment (“ROI”) | Operating Income (in millions) | |||||||||||||||||||||
| 2010 | 2011 | 2011 Target | 2011 Plan | 2011 Actual | 2010 | 2011 | |||||||||||||||||
| $ | 832.2 | $ | 950.9 | 15.6 | % | 20.0 | % | 21.1 | % | $ | 30.3 | $ | 48.1 | ||||||||||
Performance % Points Earned Performance Range Plan vs. Target ROI 128.2 % 30.0 50% = 0 100% = 15 125% = 30 Actual Performance vs Plan ROI 105.5 % 18.3 50% = 0 100% = 15 125% = 30 Actual Performance vs Target ROI 135.3 % 60.0 50% = 0 100% = 30 125% = 60 Growth in Operating Income 59.1 % 40.0 0% = 0 8% = 20 12% = 40 Growth in Sales 14.3 % 35.8 0% = 0 8% = 20 16% = 40 Points Earned based on Financial Performance 184.1 Other Factors (20 point maximum) 13.5 Total Points Earned 197.6
Payments.
Following is the total annual cash incentive award earned for calendar year| Named Executive Officer | 2011 Cash Incentive Award | Incentive Award Expressed as a Percentage of Base Salary | |||||
| Steven J. Smidler | $ | 363,000 | 110 | % | |||
| Named Executive Officer | 2010 Cash Incentive Award | Incentive Award Expressed as a Percentage of Base Salary | ||||||
| Steven J. Smidler | $ | 321,000 | 97.3 | % | ||||
Steiner and Ms. Clark. The Committee chooses the Russell 2000 Index companies for long-term financial performance comparison for much the same reason that it does for annual cash incentive awards — the Committee believes that these are the type of companies against which an investor would likely compare the company’s performance in considering investment decisions. This As part of its review of the compensation programs in 2011, the Committee reviewed the weighting of these performance factors and determined that the relative weighting was still appropriate. The following table shows the estimated awards for the company’s long-term incentive feature of the company's Stock Incentive Plan (“LTIP”) to focus executive officers on long-term performance. LTIP Awards are based on the company’s actual performance during a three-year performance period with respect to performance measures selected under the company’s Stock Incentive Plan. The payment amount for completed performance periods is determined by a comparison of the company’s financial performance for the three-year period with performance of the Russell 2000 Index for the same period. Payments attributable to completed performance periods are made in cash unless a participant has not yet achieved his or her required stock ownership level under the company’s guidelines, in which case, up to one-third of the earned award will be paid in the form of company stock. These awards are intended to qualify as performance-based compensation in accordance with the requirements of Internal Revenue Code Section 162(m).In 2010, The Committee retains the Committee granted LTIP Awards fordiscretion to eliminate or decrease the performance period 2010 – 2012 in lieu of equity grants for Mr. Keating and Ms. Clark because each of them already own a significant personal equity position in the company and have met their stock ownership requirements. Messrs. Denninger and Steiner who both joined the company in 2008 were granted LTIP Awards for the 2010 – 2012 performance period and also received restricted stock awards of 8,580 and 6,530 respectively and stock option grants of 24,300 and 18,490 shares, respectively, during 2010. Mr. Smidler did not become an executive officer until September 1, 2010 and thus was notamount payable to a participant in the 2010 – 2012 LTIP performance period.It has beenwith respect to any award.followsfollowed their hire date. This haspractice was followed with respect to Messrs. Keating, Denninger and Steiner, and resulted in no LTIP payment for at least three years after first becoming a participant. In the interim, these new executives have received stock options and restricted stock grants as described above.grants. In February 2011, the Committee determined that, as a better means of relating a new executive's incentive compensation to the company's performance against the Russell 2000 companies, it would utilize LTIP awards with one and two year performance cycles in addition to the traditional three-year performance cycle, beginning in 2011. These LTIP awards would correspondingly use one, two and three-year Russell 2000 index performance periods to determine the LTIP payment. These awardspayment, and would be of similar value as, and would replace,to the stock options and restricted stock awards forpreviously granted to new executive officers, beginning with the award year during which these LTIP awards are made. officers.joined the company in December 2009, will participate inbecame an executive officer on September 1, 2010, received three separate LTIP award cycles beginning January 2,awards in 2011 covering the periods January 1, 2011 through December 31, 2011, January 1, 2011 through December 31, 2012, and January 1, 2011 through December 31, 2013. He will receiveOne-third of the LTIP awards are expected to be paid in company stock option and restrictedif his stock grants in Februaryownership requirements are not met by the award payment date. In 2011, attributable to performance in the 2010 award year; he will not receive such grantsCommittee also granted LTIP Awards for the 2011 award year2011-2013 performance period to Messrs. Keating, Denninger and in the future.![]()
![]()
Performance Factor Weighting Three-year average return on investment 40 % Average annual compounded growth in earnings per share 40 % Three-year total return to shareholders 20 % 20082009 – 20102011 performance period are as follows:8.6%7.5%, which represents the average for the three-year performance period shown on the following table.* The company defines total investment (capitalization) as total shareholder equity plus total long-term debt (including current portion). Return on investment is net earnings divided by total investment as follows:![]()
![]()
![]()
![]()
(In Millions) 2010 2009 2008 Net Earnings $ 38,324 $ 32,649 35,107 Total Equity $ 362,670 $ 312,900 $ 274,271 Total Debt $ 148,423 $ 63,635 $ 94,165 Total Investment $ 511,093 $ 376,535 $ 368,436 Return on investment 7.5 % 8.7 % 9.5 % (In Thousands) 2011 2010 2009 Net Earnings $ 51,142 $ 35,611 24,995 Total Equity $ 373,071 $ 362,670 $ 312,900 Total Debt $ 205,207 $ 148,423 $ 63,635 Total Capitalization $ 578,278 $ 511,093 $ 376,535 Return on investment 8.8 % 7.0 % 6.6 % ![]()
![]()
![]()
![]()
![]()
![]()
![]()
![]()
![]()
2005 2006 2007 3 Year
Average 2008 2009 2010 3 Year
AverageEPS $ 0.22 $ 1.01 $ 1.46 $ 0.90 $ 1.38 $ 1.27 $ 1.47 $ 1.37 2006 2007 2008 2009 2010 2011 EPS $ 1.19 $ 1.60 $ 1.49 $ 1.43 $ 0.97 $ 1.36 $ 1.93 $ 1.42 1.371.43 ÷ $0.90) $1.42)1/3 – 1 = 15.03%-0.23%.20082009 – 20102011 is -14.6%; this performance reflects the significant global economic difficulties that began in 2008 resulting in an almost 50% decline in that year. The total return to shareholders for the two-year period 2009 and 2010 is approximately 69%62.1%.2008-20102009-2011 performance period. The table reflects complete Russell 2000 Index data for 20082009 and 20092010; however, as of February 1, 2011,3, 2012, only 18.8%19% of Russell 2000 Index data is available for the 20102011 fiscal year. Actual Russell 2000 performance for the 20082009 – 20102011 performance period may be higher or lower than what is illustrated. The company will disclose actual payments for the performance period when they are made, by filing a Form 8-K.![]()
![]()
![]()
![]()
![]()
![]()
Company
Performance Est. Russell
Performance at
50th Percentile Estimated
Percentage
Earned Performance
Weighting Estimated
AwardThree-year Average Return on Investment 8.6 % 2.0 % 200.0 % 40 % 80.0 % Average Annual Compounded Growth in Earnings per Share 15.03 % 1.7 % 197.1 % 40 % 78.8 % Three-Year Total Return to Shareholders -14.6 % -0.6 % 55.7 % 20 % 11.1 % Total Estimated Award 169.9 %
Company Performance | Est. Russell Performance at 50th Percentile | Estimated Percentage Earned | Performance Weighting | Estimated Award | ||||||||||
| Three-year Average Return on Investment | 7.5 | % | 3.3 | % | 177.8 | % | 40 | % | 71.1 | % | ||||
| Average Annual Compounded Growth in Earnings per Share | (0.23 | )% | 5.9 | % | 62.2 | % | 40 | % | 24.9 | % | ||||
| Three-Year Total Return to Shareholders | 62.1 | % | 53.9 | % | 108.7 | % | 20 | % | 21.7 | % | ||||
| Total Estimated Award | 117.7 | % | ||||||||||||
41.
| Named Executive Officer | 2008 Base Salary | Award Opportunity as a % of Base | Target Award | Performance Factor | Estimated Awards | |||||||||||||||
| Neal J. Keating | $ | 675,000 | 160 | % | $ | 1,080,000 | 169.9 | % | $ | 1,834,920 | ||||||||||
| Candace A. Clark | $ | 339,000 | 95 | % | $ | 322,050 | 169.9 | % | $ | 547,163 | ||||||||||
| Named Executive Officer | 2009 Base Salary | Award Opportunity as a % of Base | Target Award | Performance Factor | Estimated Awards | |||||||||||||
| Neal J. Keating | $ | 675,000 | 160 | % | $ | 1,080,000 | 117.7 | % | $ | 1,271,160 | ||||||||
| William C. Denninger | $ | 440,000 | 95 | % | $ | 418,000 | 117.7 | % | $ | 491,986 | ||||||||
| Gregory L. Steiner | $ | 335,000 | 95 | % | $ | 318,250 | 117.7 | % | $ | 374,580 | ||||||||
| Candace A. Clark | $ | 339,000 | 95 | % | $ | 322,050 | 117.7 | % | $ | 379,053 | ||||||||
Company Performance | Est. Russell Performance at 50th Percentile | Estimated Percentage Earned | Performance Weighting | Estimated Award | ||||||||||
| Average Return on Investment* | 8.8 | % | 5.6 | % | 168.1 | % | 40 | % | 67.2 | % | ||||
| Growth in Earnings per Share** | 41.9 | % | 17.8 | % | 187.8 | % | 40 | % | 75.1 | % | ||||
| Total Return to Shareholders*** | (4.3 | )% | (6.8 | )% | 112.2 | % | 20 | % | 22.4 | % | ||||
| Total Estimated Award | 164.7 | % | ||||||||||||
| Named Executive Officer | 2011 Base Salary | Award Opportunity as a % of Base | Target Award | Performance Factor | Estimated Awards | |||||||||||||
| Steven J. Smidler | $ | 330,000 | 110 | % | $ | 363,000 | 164.7 | % | $ | 597,861 | ||||||||
Effective January 1, 2011,44.
company.
The current agreements also restrict the circumstances under which an executive would be entitled to an IRC Section 280G tax gross-up payment require a signed release in exchange for severance benefits in all events, and contain provisions such that payments under the agreements are exempt from, or comply with, the requirements of IRC Section 409A. The Committee will address the terms of each executive’s change in control agreement at the time that it expires.
the Dodd-Frank Act.
48.
| President and CEO | 3 times salary | |||
| Participants in the LTIP under the 2003 Stock Incentive Plan | 2 times salary | |||
| All Other Corporate Officers | 1 times salary | |||
In determining whether the guidelines have been achieved at any particular point, the price of the company’s stock will be the higher of (i) the then current market value determined by the closing price on the date of the determination; or (ii) the closing price on February 21, 2006, which was $21.13. The closing price of the stock on December 31, 20102011 was $29.07$27.32 and
2011.
limit by $87,877.
Personnel & Compensation Committee2011.
| Personnel & Compensation Committee |
| Richard J. Swift, Chair |
| Brian E. Barents |
| E. Reeves Callaway III |
| A. William Higgins |
SUMMARY COMPENSATION TABLE
The table, footnotes and narrative below describe the aggregate compensation earned by each of our named executive officers for our 2008, 2009, 2010 and 20102011 fiscal years. For information on the role of each component of our executive compensation program, please, see the description under “Compensation Discussion and Analysis” beginning on page 21.
| Name and Principal Position | Year | Salary ($) | Bonus ($)(1) | Stock Awards(2) ($) | Option Awards(3) | Non-Equity Incentive Plan Compensation(4) ($) | Change in Pension Value and Nonqualified Deferred Compensation Earnings(5) ($) | All Other Compensation(6) ($) | Total ($) | |||||||||||||||||||||||||||
| NEAL J. KEATING Chairman, President and Chief Executive Officer | 2010 | 725,000 | — | — | — | 1,094,750 | 251,650 | 65,901 | 2,137,301 | |||||||||||||||||||||||||||
| 2009 | 662,019 | — | 1,111,250 | — | 730,080 | 162,419 | 41,932 | 2,707,700 | ||||||||||||||||||||||||||||
| 2008 | 675,000 | — | 910,650 | — | 446,040 | 97,766 | 434,015 | 2,563,471 | ||||||||||||||||||||||||||||
| WILLIAM C. DENNINGER Senior Vice President, and Chief Financial Officer(7) | 2010 | 478,200 | — | 223,681 | 225,781 | 444,726 | 126,992 | 31,653 | 1,531,033 | |||||||||||||||||||||||||||
| 2009 | 431,538 | — | — | — | 297,440 | 50,255 | 39,683 | 818,916 | ||||||||||||||||||||||||||||
| 2008 | 54,098 | — | 53,175 | 85,816 | 21,801 | — | 1,575 | 216,465 | ||||||||||||||||||||||||||||
| GREGORY L. STEINER President, Kaman Aerospace Group(8) | 2010 | 371,725 | 43,715 | 170,237 | 171,798 | 124,899 | 91,270 | 26,180 | 999,824 | |||||||||||||||||||||||||||
| 2009 | 328,558 | — | 129,083 | 128,845 | 226,460 | 36,583 | 26,710 | 876,239 | ||||||||||||||||||||||||||||
| 2008 | 162,910 | — | 107,975 | 173,946 | 81,455 | 9,243 | 51,442 | 586,971 | ||||||||||||||||||||||||||||
| STEVEN J. SMIDLER President, Kaman Industrial Technologies(9) | 2010 | 307,500 | 137,500 | — | — | 321,000 | — | 116,383 | 882,383 | |||||||||||||||||||||||||||
| 2009 | — | — | — | — | — | — | — | — | ||||||||||||||||||||||||||||
| 2008 | — | — | — | — | — | — | — | — | ||||||||||||||||||||||||||||
| CANDACE A. CLARK Senior Vice President and Chief Legal Officer | 2010 | 374,170 | — | — | — | 289,982 | 524,335 | 22,968 | 1,211,455 | |||||||||||||||||||||||||||
| 2009 | 332,481 | — | — | — | 848,564 | 503,679 | 27,037 | 1,711,761 | ||||||||||||||||||||||||||||
| 2008 | 339,000 | — | — | — | 540,892 | 269,550 | 42,415 | 1,191,857 | ||||||||||||||||||||||||||||
| Name and Principal Position | Year | Salary ($) | Bonus ($)(1) | Stock Awards(2) ($) | Option Awards(3) | Non-Equity Incentive Plan Compensation(4) ($) | Change in Pension Value and Nonqualified Deferred Compensation Earnings(5) ($) | All Other Compensation(6) ($) | Total ($) | |||||||||||||||||
NEAL J. KEATING Chairman, President and Chief Executive Officer | 2011 | 800,000 | — | — | — | 1,450,400 | 328,638 | 49,616 | 2,628,654 | |||||||||||||||||
| 2010 | 725,000 | — | — | — | 2,845,430 | 251,650 | 65,901 | 3,887,981 | ||||||||||||||||||
| 2009 | 662,019 | — | 1,111,250 | — | 730,080 | 162,419 | 41,932 | 2,707,700 | ||||||||||||||||||
WILLIAM C. DENNINGER Executive Vice President and Chief Financial Officer(7) | 2011 | 492,540 | — | 615,524 | — | 535,785 | 146,895 | 44,026 | 1,834,770 | |||||||||||||||||
| 2010 | 478,200 | — | 223,681 | 225,781 | 444,726 | 126,992 | 31,653 | 1,531,033 | ||||||||||||||||||
| 2009 | 431,538 | — | — | — | 297,440 | 50,255 | 39,683 | 818,916 | ||||||||||||||||||
GREGORY L. STEINER Executive Vice President, Kaman Corporation and President, Kaman Aerospace Group(8) | 2011 | 382,875 | — | 478,553 | — | 459,450 | 89,694 | 59,275 | 1,469,847 | |||||||||||||||||
| 2010 | 371,725 | 43,715 | 170,237 | 171,798 | 124,899 | 91,270 | 26,180 | 999,824 | ||||||||||||||||||
| 2009 | 328,558 | — | 129,083 | 128,845 | 226,460 | 36,583 | 26,710 | 876,239 | ||||||||||||||||||
STEVEN J. SMIDLER Executive Vice President, Kaman Corporation and President, Kaman Industrial Technologies(9) | 2011 | 330,000 | — | 190,968 | 190,672 | 363,000 | — | 69,185 | 1,143,825 | |||||||||||||||||
| 2010 | 307,500 | 137,500 | — | — | 321,000 | — | 116,383 | 882,383 | ||||||||||||||||||
| 2009 | — | — | — | — | — | — | — | — | ||||||||||||||||||
CANDACE A. CLARK Senior Vice President and Chief Legal Officer | 2011 | 385,400 | — | — | — | 353,219 | 792,846 | 61,953 | 1,593,418 | |||||||||||||||||
| 2010 | 374,170 | — | — | — | 812,025 | 524,335 | 22,968 | 1,733,498 | ||||||||||||||||||
| 2009 | 332,481 | — | — | — | 848,564 | 503,679 | 27,037 | 1,711,761 | ||||||||||||||||||
| (1) | The figure in this column in 2010 for Mr. Steiner represents a special, one-time discretionary bonus awarded to him that is attributable to the company’s receipt of a $6.6 million payment related to the claim for “look-back” interest that we filed with the IRS in connection with the Aerospace segment’s former Australia SH-2G program and the gain on sale of certain assets by the Aerospace segment during the year. The figure in this column in 2010 for Mr. Smidler represents a starting bonus which was considered necessary for his recruitment in December 2009. |
| (2) | Amounts shown in the |
| (3) | Amounts shown in the Option Awards column reflect the aggregate grant date fair value of stock options granted to our named executive officers with respect to the 2009, 2010 and 2011 fiscal years in accordance with ASC 718. For a discussion of valuation assumptions, see Note 18, in our Notes to Consolidated Financial Statements included in our Annual Report on Form 10-K for the year ended December 31, 2011. Only Mr. Smidler received grants of stock options during 2011, and these grants are discussed above in the Compensation Discussion and Analysis. See the Grants of Plan-Based Awards table for additional information about these grants. |
| (4) | Represents annual cash incentive awards earned by named executive officers during the applicable fiscal year under our Cash Bonus Plan, which plan is discussed under “Compensation Discussion and Analysis” beginning on page |
| (5) | Represents the total change in the present value of accrued benefits under our pension plan and SERP from year to year. These changes for the pension plan have been calculated by assuming all executives are employed until retirement and benefits commence at the earlier of normal retirement age (generally age 65) and the earliest age at which an unreduced pension could be received (e.g., age 63 with 30 years of service). With respect to the SERP, these changes for all years were calculated using the Pension Protection Act interest rate methodology and eliminating pre-retirement mortality assumptions (as all benefits are paid in a single lump sum). |
| (6) | The amounts included in this column consist of the following: Participation in our life insurance program for senior executives, employer matching contributions under our 401(k) Plan, supplemental employer contributions under our Deferred Compensation Plan |
| executive officers ride along on the Company aircraft when the aircraft is already going to a specific destination for a business purpose. This use has minimal cost to the company. |
| (7) | Mr. Denninger |
| (8) | Mr. Steiner |
| (9) | Mr. Smidler joined the company in December 2009, and became an executive officer and President of the Industrial Distribution segment on September 1, 2010. He was promoted to Executive Vice President in February 2012. |
Employment Agreements and Change in Control Agreements
We currently have employment agreements and change in control agreements with all named executive officers. The term of the employment agreements generally extend until January 1, 2012, subject to annual renewal thereafter, at the discretion of the Board. The change in control agreements generally extend through 2012, subject to annual renewal thereafter, at the discretion of the Board.Board, except for Mr. Smidler whose contract expires September 1, 2013. Pursuant to the employment agreements in place during 2010,2011, the named executive officers were provided the 20102011 salary levels listed in the Summary Compensation Table and target annual bonus opportunities, representing a percentage of annual base salary as described under the caption “Award Opportunities” on page 28.25. These agreements further provide for participation in our employee benefit programs generally applicable to our senior executives, except that Mr.Messrs. Keating and Mr. Steiner are entitled to continued premium payments for their lifetime under our Senior Executive Life Insurance Program under certain circumstances. The estimated post termination compensation payable to our named executive officers under these agreements are described in detail under the caption “Post Termination Payments and Benefits” beginning at page 46.45.
40
Grants of Plan-Based Awards in 20102011 Fiscal Year
The following grants were made during the 20102011 fiscal year to our named executive officers pursuant to the company’s Cash Bonus Plan and 2003 Stock Incentive Plan. There are no estimated future payouts under equity incentive plans.
Grants of Plan-Based Awards
Estimated Future Payouts
Under Non-Equity Incentive
Plan Awards All Other Stock
Awards
Number
of Shares
of Stock
or Units
(#) All Other
Option
Awards
Number of
Securities
Underlying
Options
(#) Exercise or
Base Price
of Option
Awards
($/Sh) Grant
Date
Fair Value
of Stock
and
Option Awards
($/Sh) Name Grant
Date Threshold
($) Target
($) Maximum
($) Neal J. Keating 1/1/2010 (1) $ 0 $ 725,000 $ 1,450,000 1/1/2010 (2) 1,413,750 2,827,500 William C. Denninger 1/1/2010 (1) $ 0 $ 286,920 $ 573,840 1/1/2010 (2) 549,930 1,099,860 2/22/2010 (3) 8,580 $ 26.07 2/22/2010 (4) 24,300 $ 26.07 Gregory L. Steiner 1/1/2010 (1) $ 0 $ 223,035 $ 446,070 1/1/2010 (2) 427,484 854,968 2/22/2010 (3) 6,530 $ 26.07 2/22/2010 (4) 18,490 $ 26.07 Steven J. Smidler 1/1/2010 (1) 181,500 363,000 1/1/2010 (2) — — Candace A. Clark 1/1/2010 (1) $ 0 $ 187,085 $ 374,170 1/1/2010 (2) 392,879 785,757
45.
Estimated Future Payouts Under Non-Equity Incentive Plan Awards | All Other Stock Awards Number of Shares of Stock or Units (#) | All Other Option Awards Number of Securities Underlying Options (#) | Exercise or Base Price of Option Awards ($/Sh) | Grant Date Fair Value of Stock and Option Awards ($/Sh) | ||||||||||||||||||||||||||||
| Name | Grant Date | Threshold ($) | Target ($) | Maximum ($) | ||||||||||||||||||||||||||||
| Neal J. Keating | 1/1/2010 (1) | $ | 0 | $ | 725,000 | $ | 1,450,000 | |||||||||||||||||||||||||
| 1/1/2010 (2) | 1,413,750 | 2,827,500 | ||||||||||||||||||||||||||||||
| William C. Denninger | 1/1/2010 (1) | $ | 0 | $ | 286,920 | $ | 573,840 | |||||||||||||||||||||||||
| 1/1/2010 (2) | 549,930 | 1,099,860 | ||||||||||||||||||||||||||||||
| 2/22/2010 (3) | 8,580 | $ | 26.07 | |||||||||||||||||||||||||||||
| 2/22/2010 (4) | 24,300 | $ | 26.07 | |||||||||||||||||||||||||||||
| Gregory L. Steiner | 1/1/2010 (1) | $ | 0 | $ | 223,035 | $ | 446,070 | |||||||||||||||||||||||||
| 1/1/2010 (2) | 427,484 | 854,968 | ||||||||||||||||||||||||||||||
| 2/22/2010 (3) | 6,530 | $ | 26.07 | |||||||||||||||||||||||||||||
| 2/22/2010 (4) | 18,490 | $ | 26.07 | |||||||||||||||||||||||||||||
| Steven J. Smidler | 1/1/2010 (1) | 181,500 | 363,000 | |||||||||||||||||||||||||||||
| 1/1/2010 (2) | — | — | ||||||||||||||||||||||||||||||
| Candace A. Clark | 1/1/2010 (1) | $ | 0 | $ | 187,085 | $ | 374,170 | |||||||||||||||||||||||||
| 1/1/2010 (2) | 392,879 | 785,757 | ||||||||||||||||||||||||||||||
Estimated Future Payouts Under Non-Equity Incentive Plan Awards | All Other Stock Awards Number of Shares of Stock or Units (#) | All Other Option Awards Number of Securities Underlying Options (#) | Exercise or Base Price of Option Awards ($/Sh) | Grant Date Fair Value of Stock and Option Awards ($/Sh) | ||||||||||||||||||||||||
| Name | Grant Date | Threshold ($) | Target ($) | Maximum ($) | ||||||||||||||||||||||||
| Neal J. Keating | 1/1/2011 (1) | $ | — | $ | 800,000 | $ | 1,600,000 | |||||||||||||||||||||
| 1/1/2011 (2) | 1,560,000 | 3,120,000 | ||||||||||||||||||||||||||
| William C. Denninger | 1/1/2011 (1) | $ | — | $ | 295,524 | $ | 591,048 | |||||||||||||||||||||
| 1/1/2011 (2) | 566,421 | 1,132,842 | ||||||||||||||||||||||||||
| 6/7/2011 (3) | 18,200 | $ | 33.82 | |||||||||||||||||||||||||
| Gregory L. Steiner | 1/1/2011 (1) | $ | — | $ | 229,725 | $ | 459,450 | |||||||||||||||||||||
| 1/1/2011 (2) | 440,306 | 880,612 | ||||||||||||||||||||||||||
| 6/7/2011 (3) | 14,150 | $ | 33.82 | |||||||||||||||||||||||||
| Steven J. Smidler | 1/1/2011 (1) | $ | — | $ | 181,500 | $ | 363,000 | |||||||||||||||||||||
| 1/1/2011 (2) | 363,000 | 726,000 | ||||||||||||||||||||||||||
| 1/1/2011 (4) | 363,000 | 726,000 | ||||||||||||||||||||||||||
| 1/1/2011 (5) | 363,000 | 726,000 | ||||||||||||||||||||||||||
| 2/21/2011 (6) | 6,010 | $ | 31.78 | |||||||||||||||||||||||||
| 2/21/2011 (7) | 15,820 | $ | 31.78 | |||||||||||||||||||||||||
| Candace A. Clark | 1/1/2011 (1) | $ | — | $ | 192,700 | $ | 385,400 | |||||||||||||||||||||
| 1/1/2011 (2) | 404,670 | 809,340 | ||||||||||||||||||||||||||
| (1) | Represents annual Cash Bonus Plan participation for the |
| (2) | Represents a long-term incentive award grant under the LTIP feature of the 2003 Stock Incentive Plan for the three-year performance period 1/1/ |
| (3) | Represents a restricted stock award grant under the 2003 Stock Incentive Plan. All restrictions on the awarded shares lapsed immediately upon grant, as permitted by the Plan. The awarded shares, after fulfillment of tax withholding obligations, are subject to a three year holding period following the grant date of June 7, 2011. Dividends are paid on the awarded stock at the same rate that is paid to other shareholders. The stock issued pursuant to this award is counted toward the named executive officers’ compliance with stock ownership guidelines. |
| (4) | Represents a long-term incentive award grant under the LTIP feature of the 2003 Stock Incentive Plan for the one-year performance period 1/1/11 – 12/31/11. Payments, if any are earned, will not be made until approximately June of 2012. Please see the Long-Term Incentives section of the Compensation Discussion and Analysis at page |
| (5) | Represents a long-term incentive award grant under the LTIP feature of the 2003 Stock Incentive Plan for the two-year performance period 1/1/11 – 12/31/12. Payments, if any are earned, will not be made until approximately June of 2013. Please see the Long-Term Incentives section of the Compensation Discussion and Analysis at page 32. |
| (6) | Represents a restricted stock award grant under the 2003 Stock Incentive Plan, for which restrictions lapse at the rate of |
| (7) | Represents a stock option award grant under the 2003 Stock Incentive Plan, for which restrictions lapse at the rate of 20% per year, beginning on March 1 of the year following the grant date. |
Outstanding Equity Awards at 20102011 Fiscal Year-End
The following table lists the outstanding stock options and restricted stock awards at December 31, 20102011 for each of our named executive officers. Option Awards Stock Awards Name Number of
Securities
Underlying
Unexercised
Options
(#)
Exercisable Number of
Securities
Underlying
Unexercised
Options
(#)
Unexercisable(1) Option
Exercise
Price
($) Option
Grant
Date Option
Expiration
Date Stock
Awards Number of
Shares or
Units of
Stock That
Have Not
Vested
(#) Market
Value of
Number of
Shares or
Units of
Stock That
Have Not
Vested
($)(2)(3) Neal J. Keating 9/17/2007 8,000 $ 232,560 9/23/2008 18,000 $ 523,260 10/13/2009 33,333 $ 968,990 William C. Denninger 4,000 6,000 $ 21.27 11/17/2008 11/17/2018 11/17/2008 1,500 $ 43,605 — 24,300 $ 26.07 2/22/2010 2/22/2020 2/22/2010 8,580 $ 249,421 Gregory L. Steiner 7/7/2008 3,000 $ 87,210 8,000 12,000 $ 21.60 7/7/2008 7/7/2018 4,005 16,020 $ 16.35 2/23/2009 2/23/2019 2/23/2009 6,316 $ 183,606 — 18,490 $ 26.07 2/22/2010 2/22/2020 2/22/2010 6,530 $ 189,827 Steven J. Smidler 12/1/2009 1,680 $ 48,838 Candace A. Clark 6,000 $ 16.31 2/13/2001 2/13/2011 10,530 $ 14.50 2/12/2002 2/12/2012
| Option Awards | Stock Awards | |||||||||||||||||||||||||||||||
| Name | Number of Securities Underlying Unexercised Options (#) Exercisable | Number of Securities Underlying Unexercised Options (#) Unexercisable(1) | Option Exercise Price ($) | Option Grant Date | Option Expiration Date | Stock Awards | Number of Shares or Units of Stock That Have Not Vested (#) | Market Value of Number of Shares or Units of Stock That Have Not Vested ($)(2)(3) | ||||||||||||||||||||||||
| Neal J. Keating | 9/17/2007 | 8,000 | $ | 232,560 | ||||||||||||||||||||||||||||
| 9/23/2008 | 18,000 | $ | 523,260 | |||||||||||||||||||||||||||||
| 10/13/2009 | 33,333 | $ | 968,990 | |||||||||||||||||||||||||||||
| William C. Denninger | 4,000 | 6,000 | $ | 21.27 | 11/17/2008 | 11/17/2018 | 11/17/2008 | 1,500 | $ | 43,605 | ||||||||||||||||||||||
| — | 24,300 | $ | 26.07 | 2/22/2010 | 2/22/2020 | 2/22/2010 | 8,580 | $ | 249,421 | |||||||||||||||||||||||
| Gregory L. Steiner | 7/7/2008 | 3,000 | $ | 87,210 | ||||||||||||||||||||||||||||
| 8,000 | 12,000 | $ | 21.60 | 7/7/2008 | 7/7/2018 | |||||||||||||||||||||||||||
| 4,005 | 16,020 | $ | 16.35 | 2/23/2009 | 2/23/2019 | 2/23/2009 | 6,316 | $ | 183,606 | |||||||||||||||||||||||
| — | 18,490 | $ | 26.07 | 2/22/2010 | 2/22/2020 | 2/22/2010 | 6,530 | $ | 189,827 | |||||||||||||||||||||||
| Steven J. Smidler | 12/1/2009 | 1,680 | $ | 48,838 | ||||||||||||||||||||||||||||
| Candace A. Clark | 6,000 | $ | 16.31 | 2/13/2001 | 2/13/2011 | |||||||||||||||||||||||||||
| 10,530 | $ | 14.50 | 2/12/2002 | 2/12/2012 | ||||||||||||||||||||||||||||
| Option Awards | Stock Awards | ||||||||||||||||||||||
| Name | Number of Securities Underlying Unexercised Options (#) Exercisable | Number of Securities Underlying Unexercised Options (#) Unexercisable(1) | Option Exercise Price ($) | Option Grant Date | Option Expiration Date | Stock Awards | Number of Shares or Units of Stock That Have Not Vested (#) | Market Value of Number of Shares or Units of Stock That Have Not Vested ($)(2)(3) | |||||||||||||||
| Neal J. Keating | 9/17/2007 | 4,000 | $ | 109,280 | |||||||||||||||||||
| 9/23/2008 | 12,000 | $ | 327,840 | ||||||||||||||||||||
| 10/13/2009 | 16,667 | $ | 455,342 | ||||||||||||||||||||
| William C. Denninger | 6,000 | 4,000 | $ | 21.27 | 11/17/2008 | 11/17/2018 | 11/17/2008 | 1,000 | $ | 27,320 | |||||||||||||
| 4,860 | 19,440 | $ | 26.07 | 2/22/2010 | 2/22/2020 | 2/22/2010 | 6,864 | $ | 187,524 | ||||||||||||||
| Gregory L. Steiner | 7/7/2008 | 2,000 | $ | 54,640 | |||||||||||||||||||
| 12,000 | 8,000 | $ | 21.595 | 7/7/2008 | 7/7/2018 | ||||||||||||||||||
| 4,005 | 12,015 | $ | 16.35 | 2/23/2009 | 2/23/2019 | 2/23/2009 | 4,737 | $ | 129,415 | ||||||||||||||
| 3,698 | 14,792 | $ | 26.07 | 2/22/2010 | 2/22/2020 | 2/22/2010 | 5,224 | $ | 142,720 | ||||||||||||||
| Steven J. Smidler | 12/1/2009 | 1,260 | $ | 34,423 | |||||||||||||||||||
| — | 15,820 | $ | 31.775 | 2/21/2011 | 2/21/2021 | 2/21/2011 | 6,010 | $ | 164,193 | ||||||||||||||
| Candace A. Clark | 10,530 | $ | 14.50 | 2/12/2002 | 2/12/2012 | ||||||||||||||||||
| (1) | Unless otherwise stated, options vest at the value rate of 20% per year, beginning March 1 of the year following the grant date and have a term of 10 years. Vesting of these awards may be accelerated upon death, disability, retirement or upon termination of employment following a change in control event, or in other termination of employment circumstances in accordance with the employment agreements and change in control agreements for each named executive officer and otherwise as provided in the 2003 Stock Incentive Plan. Please see the Post Termination Payments and Benefits section at page |
| (2) | Market value is calculated based on the closing price of the company’s Common Stock on December |
| (3) | Unless otherwise stated, restrictions lapse with respect to restricted stock awards at the rate of 20% per year, beginning March 1 of the year following the grant date. Lapsing of restrictions may be accelerated upon death, disability, retirement or upon termination of employment following a change in control event, or in other termination of employment circumstances in accordance with the employment agreements and change in control agreements for each named executive officer and otherwise as provided in the 2003 Stock Incentive Plan. Mr. Keating’s October 13, 2009 award has restrictions that lapse at the rate of one-third (1/3) each year beginning one year after the grant date. Please see the Post Termination Payments and Benefits section at page |
42
Option Exercises and Stock Vested in Fiscal Year 20102011
The following table provides information about the value realized by our named executive officers on the exercise of stock options and the lapse of restrictions with respect to restricted stock awards during the 20102011 fiscal year. Option Awards Stock Award Name Number of
Shares
Acquired on
Exercise (#) Value
Realized on
Exercise ($)(1) Exercise
Date Number of
Shares
Acquired on
Vesting
(#) Value
Realized on
Vesting
($)(2) Vesting
Date Neal J. Keating 4,000 $ 95,680 9/17/10 6,000 $ 153,900 9/23/10 16,667 $ 432,175 10/13/10 William C. Denninger 500 $ 13,315 11/17/10 Gregory L. Steiner 1,000 $ 21,490 7/7/10 1,579 $ 37,817 3/1/10 Steven J. Smidler 420 $ 11,831 12/1/10 Candace A. Clark 4,500 $ 42,019 9/23/10 5,470 $ 60,991 9/23/10
2011
| Option Awards | Stock Award | |||||||||||||||||||||||
| Name | Number of Shares Acquired on Exercise (#) | Value Realized on Exercise ($)(1) | Exercise Date | Number of Shares Acquired on Vesting (#) | Value Realized on Vesting ($)(2) | Vesting Date | ||||||||||||||||||
| Neal J. Keating | 4,000 | $ | 95,680 | 9/17/10 | ||||||||||||||||||||
| 6,000 | $ | 153,900 | 9/23/10 | |||||||||||||||||||||
| 16,667 | $ | 432,175 | 10/13/10 | |||||||||||||||||||||
| William C. Denninger | 500 | $ | 13,315 | 11/17/10 | ||||||||||||||||||||
| Gregory L. Steiner | 1,000 | $ | 21,490 | 7/7/10 | ||||||||||||||||||||
| 1,579 | $ | 37,817 | 3/1/10 | |||||||||||||||||||||
| Steven J. Smidler | 420 | $ | 11,831 | 12/1/10 | ||||||||||||||||||||
| Candace A. Clark | 4,500 | $ | 42,019 | 9/23/10 | ||||||||||||||||||||
| 5,470 | $ | 60,991 | 9/23/10 | |||||||||||||||||||||
| Option Awards | Stock Award | |||||||||||||||
| Name | Number of Shares Acquired on Exercise (#) | Value Realized on Exercise ($)(1) | Exercise Date | Number of Shares Acquired on Vesting (#) | Value Realized on Vesting ($)(2) | Vesting Date | ||||||||||
| Neal J. Keating | 4,000 | $ | 126,000 | 9/19/2011 | ||||||||||||
| 6,000 | $ | 159,960 | 9/23/2011 | |||||||||||||
| 16,666 | $ | 511,980 | 10/13/2011 | |||||||||||||
| William C. Denninger | 1,716 | $ | 54,689 | 3/1/2011 | ||||||||||||
| 18,200 | $ | 615,524 | 6/7/2011 | |||||||||||||
| 500 | $ | 16,000 | 11/17/2011 | |||||||||||||
| Gregory L. Steiner | 4,005 | 66,245 | 6/15/2011 | |||||||||||||
| 1,579 | $ | 50,323 | 3/1/2011 | |||||||||||||
| 1,306 | $ | 41,622 | 3/1/2011 | |||||||||||||
| 14,150 | $ | 478,553 | 6/7/2011 | |||||||||||||
| 1,000 | $ | 36,890 | 7/7/2011 | |||||||||||||
| Steven J. Smidler | 420 | $ | 13,033 | 12/1/2011 | ||||||||||||
| (1) | These amounts differ from those shown in the Summary Compensation Table. The amounts shown in the Summary Compensation Table for stock options represent the aggregate grant date fair value of awards made during |
| (2) | These amounts differ from those shown in the Summary Compensation Table. The value of restricted stock awards included in the Summary Compensation Table represents the aggregate grant date fair value of awards made during |
43
Pension Benefits
The table below shows the present value of accumulated benefits payable to each of our named executive officers at age 65 and the number of years of service credited to each of them under the Kaman Corporation Employees’ Pension Plan, which we call the “pension plan” and the SERP as of December 31, 2010.2011. Name Plan Name Number of
Years of
Service
(#) Present
Value of
Accumulated
Benefit(1)
($) Payments
During Last
Fiscal Year
($) Neal J. Keating Kaman Corporation Employees’ Pension Plan 3.38 95,473 $ — SERP 3.38 422,481 $ — William C. Denninger Kaman Corporation Employees’ Pension Plan 2.12 80,681 $ — SERP 2.12 96,566 $ — Gregory L. Steiner Kaman Corporation Employees’ Pension Plan 2.73 75,420 $ — SERP 2.73 61,676 $ — Steven J. Smidler(2) Kaman Corporation Employees’ Pension Plan 0 0 $ — SERP 0 0 $ — Candace A. Clark Kaman Corporation Employees’ Pension Plan 26 1,022,089 $ — SERP 26 2,260,640 $ —
Name Plan Name Number ofYears ofService(#) PresentValue ofAccumulatedBenefit(1)($) PaymentsDuring LastFiscal Year($) Neal J. Keating Kaman Corporation Employees’ Pension Plan 4.38
165,757
$ —
SERP 4.38
680,835
$ —
William C. Denninger Kaman Corporation Employees’ Pension Plan 3.16
153,153
$ —
SERP 3.16
170,989
$ —
Gregory L. Steiner Kaman Corporation Employees’ Pension Plan 3.63
129,382
$ —
SERP 3.63
97,408
$ —
Steven J. Smidler(2) Kaman Corporation Employees’ Pension Plan —
—
$ —
SERP —
—
$ —
Candace A. Clark Kaman Corporation Employees’ Pension Plan 27.0
1,351,945
$ —
SERP 27.0
2,723,630
$ —
_______________
| Name | Plan Name | Number of Years of Service (#) | Present Value of Accumulated Benefit(1) ($) | Payments During Last Fiscal Year ($) | ||||||||||||
| Neal J. Keating | Kaman Corporation Employees’ Pension Plan | 3.38 | 95,473 | $ | — | |||||||||||
| SERP | 3.38 | 422,481 | $ | — | ||||||||||||
| William C. Denninger | Kaman Corporation Employees’ Pension Plan | 2.12 | 80,681 | $ | — | |||||||||||
| SERP | 2.12 | 96,566 | $ | — | ||||||||||||
| Gregory L. Steiner | Kaman Corporation Employees’ Pension Plan | 2.73 | 75,420 | $ | — | |||||||||||
| SERP | 2.73 | 61,676 | $ | — | ||||||||||||
| Steven J. Smidler(2) | Kaman Corporation Employees’ Pension Plan | 0 | 0 | $ | — | |||||||||||
| SERP | 0 | 0 | $ | — | ||||||||||||
| Candace A. Clark | Kaman Corporation Employees’ Pension Plan | 26 | 1,022,089 | $ | — | |||||||||||
| SERP | 26 | 2,260,640 | $ | — | ||||||||||||
| Name | Plan Name | Number of Years of Service (#) | Present Value of Accumulated Benefit(1) ($) | Payments During Last Fiscal Year ($) | ||||||||
| Neal J. Keating | Kaman Corporation Employees’ Pension Plan | 4.38 | 165,757 | $ | — | |||||||
| SERP | 4.38 | 680,835 | $ | — | ||||||||
| William C. Denninger | Kaman Corporation Employees’ Pension Plan | 3.16 | 153,153 | $ | — | |||||||
| SERP | 3.16 | 170,989 | $ | — | ||||||||
| Gregory L. Steiner | Kaman Corporation Employees’ Pension Plan | 3.63 | 129,382 | $ | — | |||||||
| SERP | 3.63 | 97,408 | $ | — | ||||||||
| Steven J. Smidler(2) | Kaman Corporation Employees’ Pension Plan | — | — | $ | — | |||||||
| SERP | — | — | $ | — | ||||||||
| Candace A. Clark | Kaman Corporation Employees’ Pension Plan | 27.0 | 1,351,945 | $ | — | |||||||
| SERP | 27.0 | 2,723,630 | $ | — | ||||||||
| (1) | Represents the present value of accrued benefits under our pension plan and SERP based upon the following assumptions: a) for the pension plan, that each executive is employed until retirement, that his or her benefits commence at the earlier of normal retirement age (generally, age 65), and that the earliest age at which an unreduced pension could be received (e.g., age 63 with 30 years of service) and b) for the SERP, that the change to interest rate methodology required under the Pension Protection Act of 2006 and elimination of pre-retirement mortality assumptions because SERP benefits are payable as a lump sum. Please see Footnote |
| (2) | Mr. Smidler is not a participant in the pension plan or SERP because the Industrial Distribution segment closed the pension plan to new hires before Mr. Smidler joined the company. |
In February 2007, the Board alsohas been amended our SERP in order to comply with the requirements of Internal Revenue Code Section 409A. In order to preserve grandfathering treatment for benefits accrued under our SERP for years prior to January 1, 2005, we adopted a separate plan document for SERP benefits accrued by our executive officers after December 31, 2004.
| Name | Executive Contributions in Last FY ($) | Registrant Contributions in Last FY ($) | Aggregate Earnings in Last FY ($)(1) | Aggregate Withdrawals/ Distributions ($) | Aggregate Balance at Last FYE ($) | |||||||||||||||
| Neal J. Keating | $ | — | $ | — | $ | — | $ | — | $ | — | ||||||||||
| William C. Denninger | $ | — | $ | — | $ | — | $ | — | $ | — | ||||||||||
| Gregory L. Steiner | $ | — | $ | — | $ | — | $ | — | $ | — | ||||||||||
| Steven J. Smidler(2) | $ | — | $ | 30,750 | $ | 678 | $ | — | $ | 31,428 | ||||||||||
| Candace A. Clark | $ | — | $ | — | $ | 19,042 | $ | — | $ | 405,464 | ||||||||||
| Name | Executive Contributions in Last FY ($) | Registrant Contributions in Last FY ($) | Aggregate Earnings in Last FY ($)(1) | Aggregate Withdrawals/ Distributions ($) | Aggregate Balance at Last FYE ($) | |||||||||||||||
| Neal J. Keating | $ | — | $ | — | $ | — | $ | — | $ | — | ||||||||||
| William C. Denninger | $ | — | $ | — | $ | — | $ | — | $ | — | ||||||||||
| Gregory L. Steiner | $ | — | $ | — | $ | — | $ | — | $ | — | ||||||||||
Steven J. Smidler(2) | $ | 80,250 | $ | 26,825 | $ | 4,999 | $ | — | $ | 143,502 | ||||||||||
| Candace A. Clark | $ | — | $ | — | $ | 16,183 | $ | — | $ | 421,647 | ||||||||||
| (1) | Interest is credited at 120% of Applicable Federal Long-Term Rate. |
| (2) | During |
Payments Made Upon Termination for Cause By the Executive Officer or Without Good Reason
In the event of the termination of a named executive officer’s employment for cause (other than disability) or by the named executive officer without good reason, he or she will be entitled to the amounts identified under the caption “Payments Made Upon Termination” above.
“Cause” for the company to terminate the named executive officer’s employment exists if any one of the following events occurs:conviction of, or a plea of guilty to, a felony or any crime involving moral turpitude, dishonesty, fraud, theft or financial impropriety; ora determination by a majority of the Board in good faith that the named executive officer has either:has:
•willfully and continuously failed to substantially perform his or her duties;
Payments Made Upon Retirement
In the event of the retirement of a named executive officer, in addition to the items listed under the heading “Payments Made Upon Termination”, he or she will receive the following benefits:full vesting of all outstanding equity awards;a pro-rata portion of the named executive officer’s annual bonus for the performance year in which the termination occurs; payable at the same time that bonuses are paid to other senior executives (provided that if such bonuses are not paid by March 15th of the calendar year after the calendar year in which bonuses are earned, the pro-rata bonus will not be paid until the date that is six months and a day after the executive’s termination of employment and will be credited with interest calculated under Internal Revenue Code Section 1274 from March 15 until the date that it is paid);for performance periods beginning January 1, 2010, pro-rata payment in cash of each outstanding LTIP award for which the performance period has not been completed, based upon actual financial performance, as and when paid to other participants; and for performance periods beginning on January 1, 2009 or earlier, based on 100% of the target value irrespective of actual performance,value; andfor Messrs. Keating and Steiner, continued payment of life insurance premiums for the remainder of their lives provided that they retire at or after age 62; and62.For Mr. Steiner and Ms. Clark, title to the executive’s company automobile on an “as is” basis, with the automobile’s fair market value being taxable to the executive. The current leases for Mr. Steiner’s and Ms. Clark’s company vehicles will end in 2011 and will be replaced with the vehicle allowance which applies to the other named executive officers.
Retirement is generally defined as a termination of employment at or after age 65 for all named executive officers, except that the Committee determined in 2010 that the Committee should have the flexibility to permit retirement at or after age 62 if it is in the best interests of the company and its shareholders. At the Committee’s direction, the named executive officers’ employment agreements will be modified to reflect this change at such time as they are first renewed. The employment agreements for all named executive officers other than Mr. Steiner (whose agreement will be subject to renewal during 2011) werehave been amended to reflect this change during 2010.
change.
47
Payments Made Due to Qualifying Employment Termination on or After a Change in Control
The company has entered into change of control agreements with each of our named executive officers. Other than as noted below, the change in control agreements for each of our named executive officers are substantially similar.
If an executive’s employment is terminated by us without cause (other than due to death or disability) or by the executive for good reason within 90 days prior to the execution of a purchase and sale agreement resulting in a change in control or anytime thereafter until the second anniversary of a change in control, the executive will be entitled to receive the following severance benefits:a lump-sum cash payment equal to the three times the executive’s base salary, in the case of Mr. Keating, and two times, in the case of the other named executive officers, plus three times, in the case of Mr. Keating, and two times, in the case of the other named executive officers, the last annual bonus paid or awarded to the executive in the three years preceding the date of termination, which shall be payable, with interest, on the date that is six months and one business day after the executive’s termination of employment;a pro-rata portion of the named executive officer’s annual bonus for the performance year in which the termination occurs (based on actual company performance through the date of termination) payable on the later of the date that annual bonuses are generally paid to other senior executives and the date that is six months and a day after the executive’s termination of employment (if such bonus payment is not paid until the date that is six months and a day after the executive’s employment termination, the amount shall be credited with interest from March 15th until the date that it is paid);continued participation at the company’s expense for 24 months in all medical, dental and accidental death and disability plans which cover the executive and the executive’s eligible dependents, subject to offset due to future employment;full vesting of outstanding equity awards;for performance periods beginning January 1, 2010, pro-rata payment in cash of each outstanding LTIP award for which the performance period has not been completed, based upon actual financial performance, as and when paid to other participants; and for performance periods beginning on January 1, 2009 or earlier, based on 100% of the target value irrespective of actual performance;value;effective February 22, 2010, an additional three years, in the case of Mr. Keating, and two years, in the case of the other named executive officers, of continuous service under the SERP only to the extent needed to vest in their pension benefits (which requires 5 years of continuous service);benefits under any post-retirement health care plans if the executive would have otherwise become eligible for those benefits by remaining employed through the second anniversary of the employment termination date, commencing on the later of the date that such coverage would have become first available and the date on which the executive’s post-employment participation in our benefit plans, as described above, terminates; andprepayment of premiums under any life insurance policy insuring the life of the executive in the case of Messrs. Keating and Steiner, which shall be payable, with interest, on the date that is six months and one business day after the executive’s termination of employment and, in the case of Mr.Messrs. Denninger and Smidler and Ms. Clark, continued payment of remaining life insurance premium payments for which the company shall establish an irrevocable grantor trust holding assets sufficient to pay such premiums; andreimbursement for up to $30,000 (in the aggregate) for outplacement services until the earlier of the first anniversary of the date of termination or the first day of the executive’s employment with a new employer;employer.
Generally, pursuant to the agreements, a change of control occurs if:
Equity-Based AssumptionsUnvested stock options and stock appreciation rights vested on December 31, 20102011 with respect to a change in control, termination of employment without cause by us or by the named executive officer for good reason, retirement, death or disability.Unvested stock options and stock appreciation rights that become vested due to a change in control are valued based on their “spread” (i.e., the difference between the stock’s fair market value and the exercise price).It is possible that IRS rules would require these items to be valued using a valuation method such as the Black-Scholes model if they continued in existence after a change in control. Using a Black-Scholes value in lieu of the “spread” would result in higher value for excise taxes and the related tax gross-up payment.
Incentive Plan AssumptionsThe entire value of long-term incentive plan awards with a performance period that has not ended as of a change in control are fully taken into account without any discount for amounts that may earned as of the assumed change in control date for purposes of the excise tax gross-up payment.All amounts under our annual cash incentive plan were earned for 20102011 in full based on actual performance and are not treated as subject to the excise tax upon a change in control.
Retirement Benefit Assumptions
The present value of the additional service credit for retirement benefits due to a qualifying employment termination after a change in control consists of 2 years of additional credit, except in the case of Mr. Keating whose additional service credit is 3 years. This service credit would only apply in order to vest in the pension plan; no additional compensation is included.All benefits are payable in a single lump sum at the participant’s earliest retirement-eligible date.December 31, 20102011 present values for the qualified pension plan assume that all executives are employed until retirement and benefits commence at the earlier of normal retirement age (generally, age 65) and the earliest age at which an unreduced pension could be received (e.g., age 63 with 30 years of service).Present values for the SERP reflect the change to interest rate methodology required under the Pension Protection Act of 2006 and eliminate pre-retirement mortality assumptions because SERP benefits are payable as a lump sum.
Conditional Tax Gross-Up for 20% Excise Tax
A 20% excise tax is payable by a named executive officer if post termination amounts that are considered to be contingent on a change in control for tax purposes equal or exceed three times the officer’s average taxable income for the five years ended December 31, 2009.2010. This tax equals 20% of all contingent payments that exceed his or her average taxable income as described above. Amounts that are subject to the 20% excise tax are not deductible under any circumstances by the buyer.
In early 2010, the Committee notified the company’s executive officers that in the event their management agreements were renewed, it did not intend to provide an excise tax gross-up benefit. Since that time, the employment agreements for Messrs. Keating and Denninger and Ms. Clark have already been subject to annual renewal and modified to remove any reference to excise tax gross-ups. The Committee will address the terms of each executive officer’s change in control agreement at the time it expires, which will occur in September 2012 for Mr. Keating, November 2012 for Mr. Denninger, July 2013 for Mr. Steiner, and January 2012 for Ms. Clark. The Committee also determined at that time that no new management agreements would contain any excise tax gross-up benefit; therefore, no excise tax gross-up was provided in Mr. Smidler’s management agreements when he became president of Industrial Distribution in September 2010. Mr. Steiner’sSince that time, the employment agreement isagreements for Messrs. Keating, Denninger and Steiner and Ms. Clark have been subject to annual renewal and modified to remove any reference to excise tax gross-ups. Additionally, Ms. Clark's change in 2011 at which time itcontrol agreement was renewed by the Board, and was amended effective January 1, 2012, to remove the provision for excise tax gross-ups. The Committee will be modifiedaddress the terms of the change in this manner.control agreements for the other executive officers when those agreements expire.
Based on the assumption that a change in control occurred on December 31, 2010,2011, the post termination payment tables estimate the potential tax gross-up obligation based on the assumptions described above. No adjustment has been made to these amounts for the potential impact of lost deductions to a buyer after a change in control. In addition, taxable income paid prior to the year of the change in control will increase the trigger amount for the 20% excise tax.
In the event that any payments related to a change in control are subject to the 20% excise tax, the change in control
50
agreements provide for a conditional tax gross-up payment to reimburse the named executive officer for the excise tax and additional taxes resulting from the imposition of the excise tax. The gross-up payment will be made, however, only if the amounts treated as contingent on the change in control exceed the maximum amount payable under the trigger amount described above by more than $100,000. If these amounts exceed the trigger amount by $100,000 or less, then the payments to the named executive officer will be reduced to an amount that does not trigger the 20% excise tax. If a change in control were to have occurred on December 31, 2010,2011, Mr. Denninger and Mr. Steiner would have been entitled to receive a tax gross-up payment. The company anticipates that the amount allowed to be paid to these executivesMr. Denninger without triggering golden parachute excise taxes will increase over time as they eachhe earns taxable compensation attributable to short and long-term incentives. The tables assume that all payment of bonus and LTIP awards on an accelerated basis at target will be parachute payments even though that may not be the case depending upon the facts and circumstances at the time of payment.
These tables were prepared on the basis that the post-termination payments under the change in control agreement do not constitute payments subject to the golden parachute excise tax to the extent of the current estimated value of the non-compete provisions of the employment agreements as determined by an independent third party. The extent to which these payments may be subject to the golden parachute excise tax
will be determined on the basis of the facts and circumstances at the time of an event that triggers these payments under the change in control agreements.
Coordination with Other Tables
The post termination payment tables do not duplicate amounts disclosed elsewhere in this proxy statement that the named executive officer had earned a vested right to receive prior to January 1, 2011.2012. These amounts primarily include the following:Stock options, stock appreciation rights and restricted stock that vested prior to termination of employment — vested equity awards are reflected in the Outstanding Equity Awards at 20102011 Fiscal Year-End table;Pension and SERP benefits, which are reflected in the 20102011 Pension Benefits Table;Nonqualified deferred compensation vested under the Deferred Compensation Plan, which is reflected in the 20102011 Non-Qualified Deferred Compensation Plan Table; andUnreimbursed business expenses.
51
NEAL J. KEATING
Termination by Us
for Cause or
Voluntary
Termination by
Named Executive
Officer Without
Good Reason Termination by
Us without Cause
or by Named
Executive Officer
for Good
Reason on
Account of a
Change in
Control Termination
by Us without
Cause or by
Named
Executive
Officer with
Good Reason Retirement Disability Death Cash Payments:
•
Severance(1)
0 4,365,240 2,910,160 0 0 0 •
Acceleration of Long-Term Incentive(2)
0 1,550,820 1,190,820 1,190,820 1,190,820 1,190,820 Acceleration of Unvested Equity:
•
Stock Options
0 0 0 0 0 0 •
Restricted Stock(3)
0 1,724,839 1,724,839 1,724,839 1,724,839 1,724,839 Retirement Benefits and NQDC:
•
Present Value of Additional Service Credit for Retirement Benefits(4)
0 545,907 0 0 0 0 •
Non-qualified Deferred Compensation
0 0 0 0 0 0 Perquisites and Other Benefits:
•
Health & Welfare(5)
0 33,723 33,723 0 0 0 •
Life Insurance(6)
0 338,664 338,664 338,664 338,664 0 •
Outplacement Services
0 30,000 0 0 0 0 •
All Other(7)
26,140 26,140 26,140 26,140 26,140 26,140 Tax Reimbursement:
•
Excise Tax & Gross-Up
0 0 0 0 0 0 Total $ 26,140 $ 8,615,333 $ 6,224,346 $ 3,280,463 $ 3,280,463 $ 2,941,799
Termination by Usfor Cause orVoluntaryTermination byNamed ExecutiveOfficer WithoutGood Reason Termination byUs without Causeor by NamedExecutive Officerfor GoodReason onAccount of aChange inControl Terminationby Us withoutCause or byNamedExecutiveOfficer withGood Reason Retirement Disability Death Cash Payments:
• Severance(1) —
5,684,250
3,789,500
—
—
—
• Acceleration of Long-Term Incentive(2) —
1,461,166
1,461,166
1,461,166
1,461,166
1,461,166
Acceleration of Unvested Equity:
• Stock Options —
—
—
—
—
—
• Restricted Stock(3) —
892,462
892,462
892,462
892,462
892,462
Retirement Benefits and NQDC:
• Present Value of Additional Service Credit for Retirement Benefits(4) —
538,574
—
—
—
—
• Non-qualified Deferred Compensation —
—
—
—
—
—
Perquisites and Other Benefits:
• Health & Welfare(5) —
34,944
34,944
—
—
—
• Life Insurance(6) —
431,108
431,108
431,108
431,108
—
• Outplacement Services —
30,000
—
—
—
—
• All Other(7) 35,847
35,847
35,847
35,847
35,847
35,847
Tax Reimbursement:
• Excise Tax Gross-Up —
—
—
—
—
—
Total $ 35,847
$ 9,108,351
$ 6,645,027
$ 2,820,583
$ 2,820,583
$ 2,389,475
_______________
Notes:
Retirement Benefit Assumptions
Conditional Tax Gross-Up for 20% Excise Tax
A 20% excise tax is payable by a named executive officer if post termination amounts that are considered to be contingent on a change in control for tax purposes equal or exceed three times the officer’s average taxable income for the five years ended December 31, 2009.2010. This tax equals 20% of all contingent payments that exceed his or her average taxable income as described above. Amounts that are subject to the 20% excise tax are not deductible under any circumstances by the buyer.
In early 2010, the Committee notified the company’s executive officers that in the event their management agreements were renewed, it did not intend to provide an excise tax gross-up benefit. Since that time, the employment agreements for Messrs. Keating and Denninger and Ms. Clark have already been subject to annual renewal and modified to remove any reference to excise tax gross-ups. The Committee will address the terms of each executive officer’s change in control agreement at the time it expires, which will occur in September 2012 for Mr. Keating, November 2012 for Mr. Denninger, July 2013 for Mr. Steiner, and January 2012 for Ms. Clark. The Committee also determined at that time that no new management agreements would contain any excise tax gross-up benefit; therefore, no excise tax gross-up was provided in Mr. Smidler’s management agreements when he became president of Industrial Distribution in September 2010. Mr. Steiner’sSince that time, the employment agreement isagreements for Messrs. Keating, Denninger and Steiner and Ms. Clark have been subject to annual renewal and modified to remove any reference to excise tax gross-ups. Additionally, Ms. Clark's change in 2011 at which time itcontrol agreement was renewed by the Board, and was amended effective January 1, 2012, to remove the provision for excise tax gross-ups. The Committee will be modifiedaddress the terms of the change in this manner.control agreements for the other executive officers when those agreements expire.
Based on the assumption that a change in control occurred on December 31, 2010,2011, the post termination payment tables estimate the potential tax gross-up obligation based on the assumptions described above. No adjustment has been made to these amounts for the potential impact of lost deductions to a buyer after a change in control. In addition, taxable income paid prior to the year of the change in control will increase the trigger amount for the 20% excise tax.
In the event that any payments related to a change in control are subject to the 20% excise tax, the change in control
50
agreements provide for a conditional tax gross-up payment to reimburse the named executive officer for the excise tax and additional taxes resulting from the imposition of the excise tax. The gross-up payment will be made, however, only if the amounts treated as contingent on the change in control exceed the maximum amount payable under the trigger amount described above by more than $100,000. If these amounts exceed the trigger amount by $100,000 or less, then the payments to the named executive officer will be reduced to an amount that does not trigger the 20% excise tax. If a change in control were to have occurred on December 31, 2010,2011, Mr. Denninger and Mr. Steiner would have been entitled to receive a tax gross-up payment. The company anticipates that the amount allowed to be paid to these executivesMr. Denninger without triggering golden parachute excise taxes will increase over time as they eachhe earns taxable compensation attributable to short and long-term incentives. The tables assume that all payment of bonus and LTIP awards on an accelerated basis at target will be parachute payments even though that may not be the case depending upon the facts and circumstances at the time of payment.
These tables were prepared on the basis that the post-termination payments under the change in control agreement do not constitute payments subject to the golden parachute excise tax to the extent of the current estimated value of the non-compete provisions of the employment agreements as determined by an independent third party. The extent to which these payments may be subject to the golden parachute excise tax
will be determined on the basis of the facts and circumstances at the time of an event that triggers these payments under the change in control agreements.
Coordination with Other Tables
The post termination payment tables do not duplicate amounts disclosed elsewhere in this proxy statement that the named executive officer had earned a vested right to receive prior to January 1, 2011.2012. These amounts primarily include the following:Stock options, stock appreciation rights and restricted stock that vested prior to termination of employment — vested equity awards are reflected in the Outstanding Equity Awards at 20102011 Fiscal Year-End table;Pension and SERP benefits, which are reflected in the 20102011 Pension Benefits Table;Nonqualified deferred compensation vested under the Deferred Compensation Plan, which is reflected in the 20102011 Non-Qualified Deferred Compensation Plan Table; andUnreimbursed business expenses.
51
NEAL J. KEATING
Termination by Us
for Cause or
Voluntary
Termination by
Named Executive
Officer Without
Good Reason Termination by
Us without Cause
or by Named
Executive Officer
for Good
Reason on
Account of a
Change in
Control Termination
by Us without
Cause or by
Named
Executive
Officer with
Good Reason Retirement Disability Death Cash Payments:
•
Severance(1)
0 4,365,240 2,910,160 0 0 0 •
Acceleration of Long-Term Incentive(2)
0 1,550,820 1,190,820 1,190,820 1,190,820 1,190,820 Acceleration of Unvested Equity:
•
Stock Options
0 0 0 0 0 0 •
Restricted Stock(3)
0 1,724,839 1,724,839 1,724,839 1,724,839 1,724,839 Retirement Benefits and NQDC:
•
Present Value of Additional Service Credit for Retirement Benefits(4)
0 545,907 0 0 0 0 •
Non-qualified Deferred Compensation
0 0 0 0 0 0 Perquisites and Other Benefits:
•
Health & Welfare(5)
0 33,723 33,723 0 0 0 •
Life Insurance(6)
0 338,664 338,664 338,664 338,664 0 •
Outplacement Services
0 30,000 0 0 0 0 •
All Other(7)
26,140 26,140 26,140 26,140 26,140 26,140 Tax Reimbursement:
•
Excise Tax & Gross-Up
0 0 0 0 0 0 Total $ 26,140 $ 8,615,333 $ 6,224,346 $ 3,280,463 $ 3,280,463 $ 2,941,799
Termination by Usfor Cause orVoluntaryTermination byNamed ExecutiveOfficer WithoutGood Reason Termination byUs without Causeor by NamedExecutive Officerfor GoodReason onAccount of aChange inControl Terminationby Us withoutCause or byNamedExecutiveOfficer withGood Reason Retirement Disability Death Cash Payments:
• Severance(1) —
5,684,250
3,789,500
—
—
—
• Acceleration of Long-Term Incentive(2) —
1,461,166
1,461,166
1,461,166
1,461,166
1,461,166
Acceleration of Unvested Equity:
• Stock Options —
—
—
—
—
—
• Restricted Stock(3) —
892,462
892,462
892,462
892,462
892,462
Retirement Benefits and NQDC:
• Present Value of Additional Service Credit for Retirement Benefits(4) —
538,574
—
—
—
—
• Non-qualified Deferred Compensation —
—
—
—
—
—
Perquisites and Other Benefits:
• Health & Welfare(5) —
34,944
34,944
—
—
—
• Life Insurance(6) —
431,108
431,108
431,108
431,108
—
• Outplacement Services —
30,000
—
—
—
—
• All Other(7) 35,847
35,847
35,847
35,847
35,847
35,847
Tax Reimbursement:
• Excise Tax Gross-Up —
—
—
—
—
—
Total $ 35,847
$ 9,108,351
$ 6,645,027
$ 2,820,583
$ 2,820,583
$ 2,389,475
_______________
Notes:
control agreements for the other executive officers when those agreements expire.
will be determined on the basis of the facts and circumstances at the time of an event that triggers these payments under the change in control agreements.
| Termination by Us for Cause or Voluntary Termination by Named Executive Officer Without Good Reason | Termination by Us without Cause or by Named Executive Officer for Good Reason on Account of a Change in Control | Termination by Us without Cause or by Named Executive Officer with Good Reason | Retirement | Disability | Death | |||||||||||||||||||
| Cash Payments: | ||||||||||||||||||||||||
• Severance(1) | 0 | 4,365,240 | 2,910,160 | 0 | 0 | 0 | ||||||||||||||||||
• Acceleration of Long-Term Incentive(2) | 0 | 1,550,820 | 1,190,820 | 1,190,820 | 1,190,820 | 1,190,820 | ||||||||||||||||||
| Acceleration of Unvested Equity: | ||||||||||||||||||||||||
• Stock Options | 0 | 0 | 0 | 0 | 0 | 0 | ||||||||||||||||||
• Restricted Stock(3) | 0 | 1,724,839 | 1,724,839 | 1,724,839 | 1,724,839 | 1,724,839 | ||||||||||||||||||
| Retirement Benefits and NQDC: | ||||||||||||||||||||||||
• Present Value of Additional Service Credit for Retirement Benefits(4) | 0 | 545,907 | 0 | 0 | 0 | 0 | ||||||||||||||||||
• Non-qualified Deferred Compensation | 0 | 0 | 0 | 0 | 0 | 0 | ||||||||||||||||||
| Perquisites and Other Benefits: | ||||||||||||||||||||||||
• Health & Welfare(5) | 0 | 33,723 | 33,723 | 0 | 0 | 0 | ||||||||||||||||||
• Life Insurance(6) | 0 | 338,664 | 338,664 | 338,664 | 338,664 | 0 | ||||||||||||||||||
• Outplacement Services | 0 | 30,000 | 0 | 0 | 0 | 0 | ||||||||||||||||||
• All Other(7) | 26,140 | 26,140 | 26,140 | 26,140 | 26,140 | 26,140 | ||||||||||||||||||
| Tax Reimbursement: | ||||||||||||||||||||||||
• Excise Tax & Gross-Up | 0 | 0 | 0 | 0 | 0 | 0 | ||||||||||||||||||
| Total | $ | 26,140 | $ | 8,615,333 | $ | 6,224,346 | $ | 3,280,463 | $ | 3,280,463 | $ | 2,941,799 | ||||||||||||
Termination by Us for Cause or Voluntary Termination by Named Executive Officer Without Good Reason | Termination by Us without Cause or by Named Executive Officer for Good Reason on Account of a Change in Control | Termination by Us without Cause or by Named Executive Officer with Good Reason | Retirement | Disability | Death | ||||||||||||||||||
| Cash Payments: | |||||||||||||||||||||||
• Severance(1) | — | 5,684,250 | 3,789,500 | — | — | — | |||||||||||||||||
• Acceleration of Long-Term Incentive(2) | — | 1,461,166 | 1,461,166 | 1,461,166 | 1,461,166 | 1,461,166 | |||||||||||||||||
| Acceleration of Unvested Equity: | |||||||||||||||||||||||
| • Stock Options | — | — | — | — | — | — | |||||||||||||||||
• Restricted Stock(3) | — | 892,462 | 892,462 | 892,462 | 892,462 | 892,462 | |||||||||||||||||
| Retirement Benefits and NQDC: | |||||||||||||||||||||||
• Present Value of Additional Service Credit for Retirement Benefits(4) | — | 538,574 | — | — | — | — | |||||||||||||||||
| • Non-qualified Deferred Compensation | — | — | — | — | — | — | |||||||||||||||||
| Perquisites and Other Benefits: | |||||||||||||||||||||||
• Health & Welfare(5) | — | 34,944 | 34,944 | — | — | — | |||||||||||||||||
• Life Insurance(6) | — | 431,108 | 431,108 | 431,108 | 431,108 | — | |||||||||||||||||
| • Outplacement Services | — | 30,000 | — | — | — | — | |||||||||||||||||
• All Other(7) | 35,847 | 35,847 | 35,847 | 35,847 | 35,847 | 35,847 | |||||||||||||||||
| Tax Reimbursement: | |||||||||||||||||||||||
| • Excise Tax Gross-Up | — | — | — | — | — | — | |||||||||||||||||
| Total | $ | 35,847 | $ | 9,108,351 | $ | 6,645,027 | $ | 2,820,583 | $ | 2,820,583 | $ | 2,389,475 | |||||||||||
| (1) | Reflects two times (or three times in the event of a change in control) Mr. Keating’s |
| (2) | Reflects a pro-rata payment of the 3-year long-term incentive award grants made for the |
| (3) | Reflects the value of unvested restricted stock that becomes fully vested, calculated by the difference between the exercise price and the closing market price of |
| (4) | This amount does not include amounts that the named executive officer accrued under the company’s pension plan and SERP as of December 31, |
| (5) | Reflects the value of the company’s share of premium payments to be made for medical and dental for 24 months, based on |
| (6) | Reflects the value of regular annual premium based on |
| (7) | Reflects 401(k) Plan company matching contributions. Mr. Keating is also entitled to receive his contributions to this plan. The definition of accrued benefits does not include amounts already reported in the Pension Benefits table on page 44, |
| Termination by Us for Cause or Voluntary Termination by Named Executive Officer Without Good Reason | Termination by Us without Cause or by Named Executive Officer for Good Reason on Account of a Change in Control | Termination by Us without Cause or by Named Executive Officer with Good Reason | Retirement | Disability | Death | |||||||||||||||||||
| Cash Payments: | ||||||||||||||||||||||||
• Severance(1) | 0 | 1,551,280 | 1,551,280 | 0 | 0 | 0 | ||||||||||||||||||
• Acceleration of Long-Term Incentive(2) | 0 | 601,143 | 461,809 | 461,809 | 461,809 | 461,809 | ||||||||||||||||||
| Acceleration of Unvested Equity: | ||||||||||||||||||||||||
• Stock Options | 0 | 119,700 | 119,700 | 119,700 | 119,700 | 119,700 | ||||||||||||||||||
• Restricted Stock(3) | 0 | 293,026 | 293,026 | 293,026 | 293,026 | 293,026 | ||||||||||||||||||
| Retirement Benefits and NQDC: | ||||||||||||||||||||||||
• Present Value of Additional Service Credit for Retirement Benefits(4) | 0 | 214,377 | 0 | 0 | 0 | 0 | ||||||||||||||||||
• Non-qualified Deferred Compensation | 0 | 0 | 0 | 0 | 0 | 0 | ||||||||||||||||||
| Perquisites and Other Benefits: | ||||||||||||||||||||||||
• Health & Welfare(5) | 0 | 21,746 | 21,746 | 0 | 0 | 0 | ||||||||||||||||||
• Life Insurance(6) | 0 | 334,264 | 10,616 | 0 | 0 | 0 | ||||||||||||||||||
• Outplacement Services | 0 | 30,000 | 0 | 0 | 0 | 0 | ||||||||||||||||||
• All Other(7) | 0 | 0 | 0 | 0 | 0 | 0 | ||||||||||||||||||
| Tax Reimbursement: | ||||||||||||||||||||||||
• Excise Tax & Gross-Up | 0 | 950,932 | 0 | 0 | 0 | 0 | ||||||||||||||||||
| Total | $ | 0 | $ | 4,116,468 | $ | 2,458,177 | $ | 874,535 | $ | 874,535 | $ | 874,535 | ||||||||||||
Termination by Us for Cause or Voluntary Termination by Named Executive Officer Without Good Reason | Termination by Us without Cause or by Named Executive Officer for Good Reason on Account of a Change in Control | Termination by Us without Cause or by Named Executive Officer with Good Reason | Retirement | Disability | Death | ||||||||||||||||||
| Cash Payments: | |||||||||||||||||||||||
• Severance(1) | — | 1,874,532 | 1,874,532 | — | — | — | |||||||||||||||||
• Acceleration of Long-Term Incentive(2) | — | 554,920 | 554,920 | 554,920 | 554,920 | 554,920 | |||||||||||||||||
| Acceleration of Unvested Equity: | |||||||||||||||||||||||
• Stock Options(3) | — | 48,500 | 48,500 | 48,500 | 48,500 | 48,500 | |||||||||||||||||
• Restricted Stock(4) | — | 214,845 | 214,845 | 214,845 | 214,845 | 214,845 | |||||||||||||||||
| Retirement Benefits and NQDC: | |||||||||||||||||||||||
• Present Value of Additional Service Credit for Retirement Benefits(5) | — | 201,903 | — | — | — | — | |||||||||||||||||
| • Non-qualified Deferred Compensation | — | — | — | — | — | — | |||||||||||||||||
| Perquisites and Other Benefits: | |||||||||||||||||||||||
• Health & Welfare(6) | — | 22,528 | 22,528 | — | — | — | |||||||||||||||||
• Life Insurance(7) | — | 410,985 | 11,817 | — | — | — | |||||||||||||||||
| • Outplacement Services | — | 30,000 | — | — | — | — | |||||||||||||||||
• All Other(8) | 25,063 | 25,063 | 25,063 | 25,063 | 25,063 | 25,063 | |||||||||||||||||
| Tax Reimbursement: | |||||||||||||||||||||||
| • Excise Tax Gross-Up | — | 1,155,622 | — | — | — | — | |||||||||||||||||
| Total | $ | 25,063 | $ | 4,538,898 | $ | 2,752,205 | $ | 843,328 | $ | 843,328 | $ | 843,328 | |||||||||||
| (1) | Reflects two times Mr. Denninger’s |
| (2) | Reflects a pro-rata payment of the 3-year long-term incentive award grants made for the |
| (3) | Reflects the value of unvested stock options that become fully vested, calculated by the difference between the exercise price and the closing market price of $27.32 as of December 31, 2011. |
| (4) | Reflects the value of unvested restricted stock that becomes fully vested, calculated by the difference between the exercise price and the closing market price of |
| (5) | This amount does not include amounts that the named executive officer accrued under the company’s pension plan and |
| (6) | Reflects the value of the company’s share of premium payments to be made for medical and dental for 24 months, based on |
| (7) | Reflects the value of regular annual premium based on |
| (8) | Reflects 401(k) Plan company matching contributions. Mr. Denninger is not vested in the company’s 401(k) plan company matching contributions. Mr. Denninger would entitled to receive his contributions to this plan The definition of accrued benefits does not include amounts already reported in the Pension Benefits table on page 44, |
| Termination by Us for Cause or Voluntary Termination by Named Executive Officer Without Good Reason | Termination by Us without Cause or by Named Executive Officer for Good Reason on Account of a Change in Control | Termination by Us without Cause or by Named Executive Officer with Good Reason | Retirement | Disability | Death | |||||||||||||||||||
| Cash Payments: | ||||||||||||||||||||||||
• Severance(1) | 0 | 1,196,370 | 1,196,370 | 0 | 0 | 0 | ||||||||||||||||||
• Acceleration of Long-Term Incentive(2) | 0 | 460,615 | 354,531 | 354,531 | 354,531 | 354,531 | ||||||||||||||||||
| Acceleration of Unvested Equity: | ||||||||||||||||||||||||
• Stock Options | 0 | 348,945 | 348,945 | 348,945 | 348,945 | 348,945 | ||||||||||||||||||
• Restricted Stock(3) | 0 | 460,643 | 460,643 | 460,643 | 460,643 | 460,643 | ||||||||||||||||||
| Retirement Benefits and NQDC: | ||||||||||||||||||||||||
• Present Value of Additional Service Credit for Retirement Benefits(4) | 0 | 126,428 | 0 | 0 | 0 | 0 | ||||||||||||||||||
• Non-qualified Deferred Compensation | 0 | 0 | 0 | 0 | 0 | 0 | ||||||||||||||||||
| Perquisites and Other Benefits: | ||||||||||||||||||||||||
• Health & Welfare(5) | 0 | 10,873 | 10,873 | 0 | 0 | 0 | ||||||||||||||||||
• Life Insurance(6) | 0 | 209,941 | 209,941 | 209,941 | 209,941 | 0 | ||||||||||||||||||
• Auto Allowance(7) | 0 | 25,925 | 25,925 | 25,925 | 0 | 0 | ||||||||||||||||||
• Outplacement Services | 0 | 30,000 | 0 | 0 | 0 | 0 | ||||||||||||||||||
• All Other(8) | 18,872 | 18,872 | 18,872 | 18,872 | 18,872 | 18,872 | ||||||||||||||||||
| Tax Reimbursement: | ||||||||||||||||||||||||
• Excise Tax & Gross-Up | 0 | 591,997 | 0 | 0 | 0 | 0 | ||||||||||||||||||
| Total | $ | 18,872 | $ | 3,480,609 | $ | 2,626,100 | $ | 1,418,857 | $ | 1,392,932 | $ | 1,182,991 | ||||||||||||
Termination by Us for Cause or Voluntary Termination by Named Executive Officer Without Good Reason | Termination by Us without Cause or by Named Executive Officer for Good Reason on Account of a Change in Control | Termination by Us without Cause or by Named Executive Officer with Good Reason | Retirement | Disability | Death | ||||||||||||||||||
| Cash Payments: | |||||||||||||||||||||||
• Severance(1) | — | 1,102,978 | 1,102,978 | — | — | — | |||||||||||||||||
• Acceleration of Long-Term Incentive(2) | — | 431,364 | 431,364 | 431,364 | 431,364 | 431,364 | |||||||||||||||||
| Acceleration of Unvested Equity: | |||||||||||||||||||||||
• Stock Options(3) | — | 196,097 | 196,097 | 196,097 | 196,097 | 196,097 | |||||||||||||||||
• Restricted Stock(4) | — | 326,774 | 326,774 | 326,774 | 326,774 | 326,774 | |||||||||||||||||
| Retirement Benefits and NQDC: | |||||||||||||||||||||||
• Present Value of Additional Service Credit for Retirement Benefits(5) | — | 139,526 | — | — | — | — | |||||||||||||||||
| • Non-qualified Deferred Compensation | — | — | — | — | — | — | |||||||||||||||||
| Perquisites and Other Benefits: | |||||||||||||||||||||||
• Health & Welfare(6) | — | 11,283 | 11,283 | — | — | — | |||||||||||||||||
• Life Insurance(7) | — | 271,409 | 271,409 | 271,409 | 271,409 | — | |||||||||||||||||
| • Outplacement Services | — | 30,000 | — | — | — | — | |||||||||||||||||
• All Other(8) | 30,812 | 30,812 | 30,812 | 30,812 | 30,812 | 30,812 | |||||||||||||||||
| Tax Reimbursement: | |||||||||||||||||||||||
| • Excise Tax Gross-Up | — | — | — | — | — | — | |||||||||||||||||
| Total | $ | 30,812 | $ | 2,540,243 | $ | 2,370,717 | $ | 1,256,456 | $ | 1,256,456 | $ | 985,047 | |||||||||||
| (1) | Reflects two times Mr. Steiner’s |
| (2) | Reflects a pro-rata payment of the 3-year long-term incentive award grants made for the |
| (3) | Reflects the value of unvested stock options that become fully vested, calculated by the difference between the exercise price and the closing market price of $27.32 as of December 31, 2011. |
| (4) | Reflects the value of unvested restricted stock that becomes fully vested, calculated by the difference between the exercise price and the closing market price of |
| (5) | This amount does not include amounts that the named executive officer accrued under the company’s pension plan and |
| (6) | Reflects the value of the company’s share of premium payments to be made for medical and dental for 24 months, based on |
| (7) | Reflects the value of regular annual premium based on |
| (8) | Reflects 401(k) Plan company matching contributions. Mr. Steiner is also entitled to receive his contributions to this |
| Termination by Us for Cause or Voluntary Termination by Named Executive Officer Without Good Reason | Termination by Us without Cause or by Named Executive Officer for Good Reason on Account of a Change in Control | Termination by Us without Cause or by Named Executive Officer with Good Reason | Retirement | Disability | Death | |||||||||||||||||||
| Cash Payments: | ||||||||||||||||||||||||
• Severance(1) | 0 | 660,000 | 660,000 | 0 | 0 | 0 | ||||||||||||||||||
• Acceleration of Long-Term Incentive(2) | 0 | 0 | 0 | 0 | 0 | 0 | ||||||||||||||||||
| Acceleration of Unvested Equity: | ||||||||||||||||||||||||
• Stock Options | 0 | 0 | 0 | 0 | 0 | 0 | ||||||||||||||||||
• Restricted Stock(3) | 0 | 48,838 | 48,838 | 48,838 | 48,838 | 48,838 | ||||||||||||||||||
| Retirement Benefits and NQDC: | ||||||||||||||||||||||||
• Present Value of Additional Service Credit for Retirement Benefits(4) | 0 | 0 | 0 | 0 | 0 | 0 | ||||||||||||||||||
• Non-qualified Deferred Compensation | 0 | 0 | 0 | 0 | 0 | 0 | ||||||||||||||||||
| Perquisites and Other Benefits: | ||||||||||||||||||||||||
• Health & Welfare(5) | 0 | 25,530 | 25,530 | 0 | 0 | 0 | ||||||||||||||||||
• Life Insurance(6) | 0 | 197,016 | 3,183 | 0 | 0 | 0 | ||||||||||||||||||
• Outplacement Services | 0 | 30,000 | 0 | 0 | 0 | 0 | ||||||||||||||||||
• All Other(7) | 0 | 0 | 0 | 0 | 0 | 0 | ||||||||||||||||||
| Tax Reimbursement: | ||||||||||||||||||||||||
• Excise Tax & Gross-Up | 0 | 0 | 0 | 0 | 0 | 0 | ||||||||||||||||||
| Total | $ | 0 | $ | 961,384 | $ | 737,551 | $ | 48,838 | $ | 48,838 | $ | 48,838 | ||||||||||||
Termination by Us for Cause or Voluntary Termination by Named Executive Officer Without Good Reason | Termination by Us without Cause or by Named Executive Officer for Good Reason on Account of a Change in Control | Termination by Us without Cause or by Named Executive Officer with Good Reason | Retirement | Disability | Death | ||||||||||||||||||
| Cash Payments: | |||||||||||||||||||||||
• Severance(1) | — | 1,302,000 | 1,302,000 | — | — | — | |||||||||||||||||
• Acceleration of Long-Term Incentive(2) | — | 302,141 | 302,141 | 302,141 | 302,141 | 302,141 | |||||||||||||||||
| Acceleration of Unvested Equity: | |||||||||||||||||||||||
• Stock Options(3) | — | — | — | — | — | — | |||||||||||||||||
• Restricted Stock(4) | — | 198,617 | 198,617 | 198,617 | 198,617 | 198,617 | |||||||||||||||||
| Retirement Benefits and NQDC: | |||||||||||||||||||||||
• Present Value of Additional Service Credit for Retirement Benefits(5) | — | — | — | — | — | — | |||||||||||||||||
• Non-qualified Deferred Compensation | — | — | — | — | — | — | |||||||||||||||||
| Perquisites and Other Benefits: | |||||||||||||||||||||||
• Health & Welfare(6) | — | 25,751 | 25,751 | — | — | — | |||||||||||||||||
• Life Insurance(7) | — | 259,096 | 3,598 | — | — | — | |||||||||||||||||
• Outplacement Services | — | 30,000 | — | — | — | — | |||||||||||||||||
• All Other(8) | — | — | — | — | — | — | |||||||||||||||||
| Tax Reimbursement: | |||||||||||||||||||||||
| • Excise Tax Gross-Up | — | — | — | ��� | — | — | |||||||||||||||||
| Total | $ | — | $ | 2,117,605 | $ | 1,832,107 | $ | 500,758 | $ | 500,758 | $ | 500,758 | |||||||||||
| (1) | Reflects two times Mr. Smidler’s |
| (2) |
| (3) | Reflects the value of unvested stock options that become fully vested, calculated by the difference between the exercise price and the closing market price of $27.32 as of December 31, 2011. |
| (4) | Reflects the value of unvested restricted stock that becomes fully vested, calculated by the difference between the exercise price and the closing market price of |
| (5) | Mr. Smidler is not a participant in the company’s pension plan or SERP. |
| (6) | Reflects the value of the company’s share of premium payments to be made for medical and dental for 24 months, based on |
| (7) | Reflects the value of regular annual premium based on |
| (8) | Reflects 401(k) Plan company matching contributions. Mr. Smidler is not vested in the company’s 401(k) plan company matching contributions. Mr. Smidler would entitled to receive his elective deferral contributions to this plan, which are always fully-vested when made. The definition of accrued benefits does not include unreimbursed business expenses that may be due. |
| Termination by Us for Cause or Voluntary Termination by Named Executive Officer Without Good Reason | Termination by Us without Cause or by Named Executive Officer for Good Reason on Account of a Change in Control | Termination by Us without Cause or by Named Executive Officer with Good Reason | Retirement | Disability | Death | |||||||||||||||||||
| Cash Payments: | ||||||||||||||||||||||||
• Severance(1) | 0 | 1,206,668 | 1,206,668 | 0 | 0 | 0 | ||||||||||||||||||
• Acceleration of Long-Term Incentive(2) | 0 | 452,890 | 345,540 | 345,540 | 345,540 | 345,540 | ||||||||||||||||||
| Acceleration of Unvested Equity: | ||||||||||||||||||||||||
• Stock Options | 0 | 0 | 0 | 0 | 0 | 0 | ||||||||||||||||||
• Restricted Stock(3) | 0 | 0 | 0 | 0 | 0 | 0 | ||||||||||||||||||
| Retirement Benefits and NQDC: | ||||||||||||||||||||||||
• Present Value of Additional Service Credit for Retirement Benefits(4) | 0 | 217,874 | 0 | 0 | 0 | 0 | ||||||||||||||||||
• Non-qualified Deferred Compensation | 0 | 0 | 0 | 0 | 0 | 0 | ||||||||||||||||||
| Perquisites and Other Benefits: | ||||||||||||||||||||||||
• Health & Welfare(5) | 0 | 21,746 | 21,746 | 0 | 0 | 0 | ||||||||||||||||||
• Life Insurance(6) | 0 | 282,219 | 6,778 | 0 | 0 | 0 | ||||||||||||||||||
• Auto Allowance(7) | 0 | 29,875 | 29,875 | 29,875 | 0 | 0 | ||||||||||||||||||
• Outplacement Services | 0 | 30,000 | 0 | 0 | 0 | 0 | ||||||||||||||||||
• All Other(8) | 113,219 | 113,219 | 113,219 | 113,219 | 113,219 | 113,219 | ||||||||||||||||||
| Tax Reimbursement: | ||||||||||||||||||||||||
• Excise Tax & Gross-Up | 0 | 0 | 0 | 0 | 0 | 0 | ||||||||||||||||||
| Total | $ | 113,219 | $ | 2,354,491 | $ | 1,723,826 | $ | 488,634 | $ | 458,759 | $ | 458,759 | ||||||||||||
Termination by Us for Cause or Voluntary Termination by Named Executive Officer Without Good Reason | Termination by Us without Cause or by Named Executive Officer for Good Reason on Account of a Change in Control | Termination by Us without Cause or by Named Executive Officer with Good Reason | Retirement | Disability | Death | ||||||||||||||||||
| Cash Payments: | |||||||||||||||||||||||
• Severance(1) | — | 1,350,764 | 1,350,764 | — | — | — | |||||||||||||||||
• Acceleration of Long-Term Incentive(2) | — | 396,447 | 396,447 | 396,447 | 396,447 | 396,447 | |||||||||||||||||
| Acceleration of Unvested Equity: | |||||||||||||||||||||||
• Stock Options | — | — | — | — | — | — | |||||||||||||||||
| • Restricted Stock | — | — | — | — | — | — | |||||||||||||||||
| Retirement Benefits and NQDC: | |||||||||||||||||||||||
• Present Value of Additional Service Credit for Retirement Benefits(3) | — | 260,026 | — | — | — | — | |||||||||||||||||
| • Non-qualified Deferred Compensation | — | — | — | — | — | — | |||||||||||||||||
| Perquisites and Other Benefits: | |||||||||||||||||||||||
• Health & Welfare(4) | — | 22,528 | 22,528 | — | — | — | |||||||||||||||||
• Life Insurance(5) | — | 359,259 | 7,688 | — | — | — | |||||||||||||||||
• Outplacement Services | — | 30,000 | — | — | — | — | |||||||||||||||||
• All Other(6) | 127,197 | 127,197 | 127,197 | 127,197 | 127,197 | 127,197 | |||||||||||||||||
| Tax Reimbursement: | |||||||||||||||||||||||
• Excise Tax Gross-Up | — | — | — | — | — | — | |||||||||||||||||
| Total | $ | 127,197 | $ | 2,546,221 | $ | 1,904,624 | $ | 523,644 | $ | 523,644 | $ | 523,644 | |||||||||||
| (1) | Reflects two times Ms. Clark’s |
| (2) | Reflects a pro-rata payment of the 3-year long-term incentive award grants made for the |
| This amount does not include amounts that the named executive officer accrued under the company’s pension plan and SERP as of December 31, |
| (4) | Reflects the value of the company’s share of premium payments to be made for medical and dental for 24 months, based on |
| (5) | Reflects the value of regular annual premium based on |
obligation accelerates upon a Change in Control; the estimated pre-payment for life insurance premium payments as of 12/31/2011 is illustrated in this chart assuming mortality based on blended RP2000 (as required by the Pension Protection Act of 2006), and interest at 3.55%.
| Reflects 401(k) Plan company matching contributions. Ms. Clark is also entitled to receive her contributions to this plan. The definition of accrued benefits does not include amounts already reported in the Pension Benefits table on page 44, |
Risk Assessment of Compensation Policies and PracticesManagement,
During 2011, management, including the company’s Internal Audit Department, has reviewed existing incentive compensation programs in which executives who are not named executive officers participate in order to confirm that such programs do not create risks that are reasonably likely to have a material adverse effect on the company. Incentive compensation programs exist at our Corporate headquarters and at both the Aerospace and Industrial Distribution segments and no particular business carries a significant portion of the company’s overall risk profile. Stock incentive awards are also available under the company’s 2003 Stock Incentive Plan for executives recommended by senior management at each business segment and at our Corporate Headquarters. These awards are determined based upon parameters developed by the Personnel & Compensation Committee’s independent consultant and all awards are reviewed and approved by the Personnel & Compensation Committee. The cash incentive compensation program for Corporate executives is subject to performance parameters and dollar limitations with supervisor recommendations reviewed and approved by the VP-Human Resources and Chief Executive Officer. Cash incentive programs at the Aerospace segment tend to be discretionary in nature with review and approval of all recommendations by the division senior management as well as the Aerospace segment President. Cash incentive programs at the Industrial Distribution segment tend to be based upon degree of attainment of specific financial performance goals which, overall, are developed on a basis consistent with the segment’s longer-term financial goals. These programs are subject to review by the Industrial Distribution VP-Human Resources and the segment President. On the basis of this review, our management has concluded that existing incentive programs applicable to non-named executive officers do not create risks that are reasonably likely to have a material adverse effect on the company.
PROPOSAL 2
The Board recommends a vote “FOR” this Proposal.
Background
Management,
This year we are including a non-binding shareholder vote proposal on our executive compensation program as described in this proxy statement for approval at the annual meeting. This has become commonly known as a “Say on Pay” vote and is required by recent federal legislation.
We encourage shareholders to review the Compensation Discussion and Analysis and the accompanying compensation tables and narrative located at pages 21 through 40 for a thorough explanation of our approach to executive compensation and how our named executive officers’ actual pay has correlated with the company’s financial performance. Our fundamental objectives are to:
We maintain meaningful stock ownership guidelines and require that up to 1/3 of a cash LTIP be paid in stock if the company’s stock ownership guidelines have not been attained by a named executive officer. To protect against inappropriate risk taking, we use caps on potential awards for both annual and long-term incentives and our executives have agreed to be subject to claw back policies as implemented by the Board following SEC further ruling making under Dodd-Frank. In February 2011, the Committee also recommended, and the Board adopted, an anti-hedging policy which provides that no director or executive officer may speculate in company stock or debt securities, including hedging or any type of arrangement that would have a similar economic effect.
As we discuss in the Compensation Discussion and Analysis, we believe that the compensation paid to our named executive officers for 2010 bears a direct and corresponding relationship to the company’s 2010 financial performance.
Board Recommendation
The Board believes that the company’s executive compensation program effectively reflects the objectives described abovein the Compensation Discussion and Analysis and therefore, recommends that shareholders voteFOR the following resolution:
PROPOSAL 3
PROVIDE AN ADVISORY VOTE ON THE FREQUENCY OF THE EXECUTIVE COMPENSATION ADVISORY VOTE
Background
This year we are including a non-binding shareholder vote to advise us about whether the advisory vote on our executive compensation program should be held every 1, 2 or 3 years. This advisory vote is also required by recent federal legislation and it will be held at least once every 6 years.
We believe that our executive compensation program does a good job of balancing the need to attract and retain talented individuals while providing incentive compensation that is directly linked to the company’s financial performance. We welcome our shareholders’ expression of their views on the program and therefore, we believe that shareholders should have that opportunity every year. That does not mean that shareholder views would be implemented immediately as this vote is non-binding and the Board would need time to thoughtfully consider appropriate changes to its program.
Board Recommendation
The Board recommends that shareholders select “One Year” on Proposal 3 recommending frequency of the executive compensation advisory vote.
We also want to remind our shareholders that they have additional opportunities to express their views regarding executive compensation matters, including periodic shareholder approval requirements for our Cash Bonus Plan and Stock Incentive Plan under federal tax laws. Shareholders also have the ability to communicate directly with the board as described under the caption “Communications with the Board” on page 17.
Because this vote is advisory, neither the company nor the Board is required to take action in response to the outcome of the vote on this Proposal. Shareholders can be assured, however, that the shareholder sentiment expressed by the vote will be carefully considered by the Personnel & Compensation Committee and the Board in crafting their approach to executive compensation matters.
PROPOSAL 4
RATIFICATION OF APPOINTMENT OF KPMG LLP AS INDEPENDENT REGISTERED PUBLIC ACCOUNTING FIRM FOR THE COMPANY
AUDIT COMMITTEE REPORT
The directors named below constitute the current Audit Committee (the “Committee”) of the board. We each serve for a term of one year and until our successors are elected and qualify. The board has made an affirmative determination that each of us is independent, as defined by the Nasdaq Stock Market, Inc.applicable exchange rules and the SEC and otherwise in accordance with the Committee’s charter and our Governance Principles. Further, the Board has made an affirmative determination that in light of our respective backgrounds and experiences, we each meet the financial literacy requirements for service to the Committee, and that Mr. Huston,Ms. Kraus and upon Mr. Huston’s retirement, Mr.Messrs. Minnich and Ms. KrausRabaut possess the qualifications for service as Committee financial experts.
2011.
Audit Committee George E. Minnich, Chair Brian E. Barents Eileen S. Kraus Thomas W. Rabaut | |||
| Fee Category | 2010 Fees | 2009 Fees | ||||||
| (In Thousands) | ||||||||
| Audit Fees | $ | 1,296.1 | $ | 1,267.8 | ||||
| Audit-Related Fees | 342.0 | 107.3 | ||||||
| Tax Fees | 496.5 | 464.1 | ||||||
| Total Fees | $ | 2,134.6 | $ | 1,839.2 | ||||
| Fee Category | 2011 Fees | 2010 Fees | |||||
| (In Thousands) | |||||||
| Audit Fees | $ | 1,471.3 | $ | 1,296.1 | |||
| Audit-Related Fees | 61.0 | 342.0 | |||||
| Tax Fees | 522.8 | 496.5 | |||||
| Total Fees | $ | 2,055.1 | $ | 2,134.6 | |||
| Compensation Element | ||||||||||||||||||||||||||||||
| Surveys | Base Salary | Annual Bonus Target | Long-term Compensation Target | Approximate Number of Participants | ||||||||||||||||||||||||||
| AonHewitt — Executive Compensation Survey | X | X | X | 654 | Fortune 1000 companies | |||||||||||||||||||||||||
| Towers Watson — Executive Compensation Database | X | X | X | 411 | Fortune 1000 companies | |||||||||||||||||||||||||
CEO Base Salary and Target Bonus
| Company | Most Recently Reported Revenues (millions) | ||||
| Albany International | $ | 871,045 | |||
| Barnes Group | $ | 1,034,200 | |||
| Callaway Golf | $ | 950,799 | |||
| Carpenter Technology | $ | 853,000 | |||
| Enpro Industries | $ | 803,000 | |||
| Esterline Technologies | $ | 1,526,601 | |||
| H B Fuller | $ | 1,234,659 | |||
| Hexcel Corp | $ | 1,108,300 | |||
| Intermec Inc. | $ | 658,200 | |||
| Moog Inc | $ | 2,114,252 | |||
| Nordson Corp | $ | 1,041,551 | |||
| Plexus Corp | $ | 2,013,393 | |||
| Schulman (A) Co | $ | 1,590,443 | |||
| Spartec Corp | $ | 926,777 | |||
| Stepan Co | $ | 1,276,382 | |||
| Superior Industries Int’l | $ | 418,846 | |||
| Technitrol Inc | $ | 398,803 | |||
| Teledyne Technologies | $ | 1,765,200 | |||
| Tupperware Brands | $ | 2,127,500 | |||
| Valmont Industries | $ | 1,786,601 | |||
| Average | $ | 1,224,978 | |||
| Median | $ | 1,074,926 | |||
| 75th Percentile | $ | 1,634,132 | |||
| Note: Data taken from most recent Form 10-K and proxy statements as of November 2010. | |||||
| Company | Most Recently Reported Revenues (millions) | ||
| AAR Corp.* | $ | 1,352,151 | |
| Albany International | $ | 914,356 | |
| Applied Industrial Tech Inc.* | $ | 1,893,208 | |
| Barnes Group | $ | 1,133,199 | |
| Callaway Golf | $ | 967,656 | |
| Curtiss Wright* | $ | 1,893,134 | |
| Esterline Technologies | $ | 1,526,601 | |
| H B Fuller | $ | 1,356,161 | |
| Hexcel Corp. | $ | 1,173,600 | |
| Intermec Inc. | $ | 679,111 | |
| Loral Space & Communications* | $ | 1,158,985 | |
| Moog Inc. | $ | 2,114,252 | |
| Nordson Corp. | $ | 1,041,551 | |
| Plexus Corp. | $ | 2,013,393 | |
| Sauer-Danfoss Inc.* | $ | 1,640,583 | |
| Schulman (A) Co. | $ | 1,590,443 | |
| Spartec Corp. | $ | 1,022,896 | |
| Stepan Co. | $ | 1,431,122 | |
| Superior Industries Int’l | $ | 719,500 | |
| Teledyne Technologies | $ | 1,644,200 | |
| Triumph Group* | $ | 2,905,348 | |
| Tupperware Brands | $ | 2,300,400 | |
| Median | $ | 1,393,642 | |
75th Percentile | $ | 1,830,901 | |
| Note: Data taken from most recent Form 10-K and proxy statements as of November 2011. | |||
| * |
![[GRAPHIC MISSING]](https://capedge.com/proxy/DEF 14A/0001144204-11-011585/v211797_pcard-1.jpg)
![[GRAPHIC MISSING]](https://capedge.com/proxy/DEF 14A/0001144204-11-011585/v211797_pcard-2.jpg)